Good evening everyone, Some novice ques
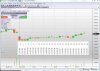
i have attached a chart of 15 Min TF, there should be 26 candles but the chart shows only 25 candles ie, the candle from 3:16 to 3:30 is missing and whenever i see the nifty, it shows NIFTY17JULFUT---- why so when the closing is 27-JULY-2017
what mistake am i doing, pls guide - - i am in the trading world for only few months ie from April 2017.
sorry to bother you.
Attachments
-
 90.2 KB Views: 15

")