Amrutham sir..today in Nifty..paper umberlla is formed...this is formed in upward rally..means hanging man. Help me to understand i am reading the candle sticks patterns correctly??
Its sure looks like hanging man. If the next day (tomorrow) is a red candle, then short trade can be initiated with SL as recent high.
Source: Zerodha Varsity
The Hanging man
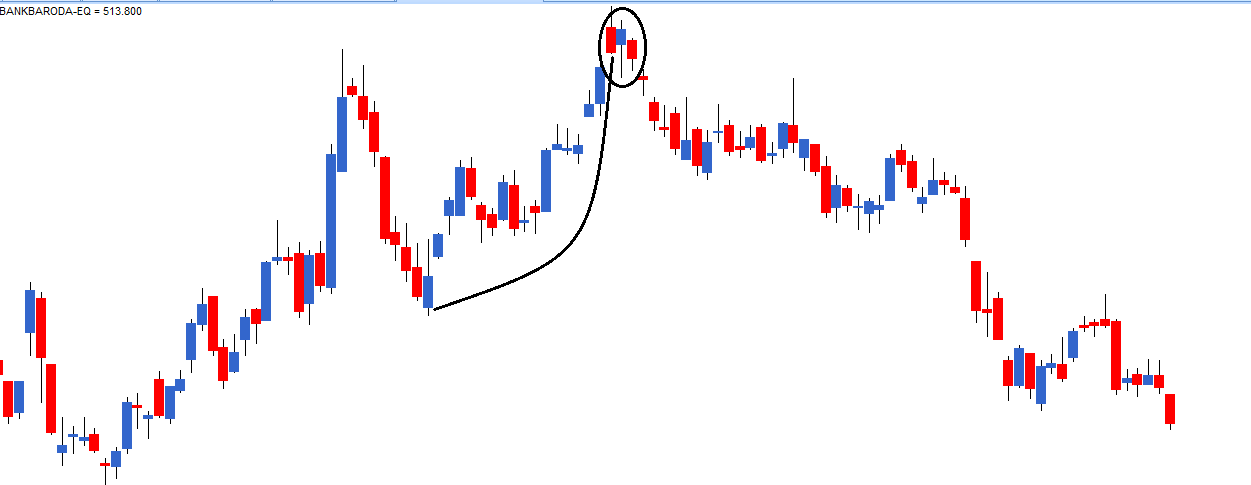
If a paper umbrella appears at the top end of a trend, it is called a Hanging man. The bearish hanging man is a single candlestick, and a top reversal pattern. A hanging man signals a market high. The hanging man is classified as a hanging man
only if is preceded by an uptrend. Since the hanging man is seen after a high, the bearish hanging man pattern signals selling pressure.
A hanging man can be of any color and it does not really matter as long as it qualifies ‘the shadow to real body’ ratio. The prior trend for the hanging man
should be an uptrend, as highlighted by the curved line in the chart above. The thought process behind a hanging man is as follows:
- The market is in an uptrend, hence the bulls are in absolute control
- The market is characterized by new highs and higher lows
- The day the hanging man pattern appears, the bears have managed to make an entry
- This is emphasized by a long lower shadow of the hanging man
- The entry of bears signifies that they are trying to break the strong hold of the bulls
Thus, the hanging man makes a case for shorting the stock. The trade set up would be as follows:
- For the risk taker, a short trade can be initiated the same day around the closing price
- For the risk averse, a short trade can be initiated at the close of the next day after ensuring that a red candle would appear
- The method to validate the candle for the risk averse, and risk taker is exactly the same as explained in the case of a hammer pattern
Once the short has been initiated, the high of the candle works as a stoploss for the trade.


 .. at least I'm not able to find any