TA indicators don't agree with each other

#21
swingtrader said:
Relative Strength (not to be confused with RSI) shows the relative strength of a stock vs another stock or the market itself. But I am not aware of any websites that provide charts with this indicator.

--SwingTrader
In technical analysis, sometimes the simplest tools are the most powerful.

One of the indicators to which every investor must pay attention to is the relative strength!

I learnt a lot from traders edge article on External Relative Strength
 
#22
swingtrader said:
About Stop Loss Exits for the above system

When you enter trades there will always be failed trades, that is part of trading. The main thing to ensure here is that you don't lose too much and have more than enough capital for taking the next trade that fits your criteria.

In the attached Ranbaxy chart I have pointed out one additional trade that failed when the uptrend finally ended. Stop loss order is required on each trade to ensure you don't lose too much on failed trades. This decision has to be made before you enter the trade and the stop loss order should be put in as soon as you enter a trade.

There are many types of stop loss exits but I won't go into them here (I will go into detail later in a different thread). The idea here is to keep it simple.

Fixed Amount based Stop Loss: You can put a stop order based on the maximum amount you are prepared to lose on a single trade. It is suggested that this amount shouldn't generally be more than 2% of your total account equity. This type of stop should probably be avoided because there is no rationale behind this type of exit.

Recent Short Term Support: For the system we are discussing it makes sense to place a stop order few ticks below the recent swing low/high. This is because we expect the price to move in our favour after we have entered the trade, so if it doesn't and it moves past the recent swing low/high then the reason to enter the trade has been defeated so it is best to get out of the trade. I have pointed out such stops in the attached chart with a small orange colored bars.

The above suggested stop is very simplistic but makes sense for the type of trade we are entering. There are many other good stop loss strategies based on ATR (Avg True Range) multiples & MAE (Maximum Adverse Excursion) but the discussion would have got really complex. I will post these with examples in another thread.

Always take stop losses, there will be many good trades available to take later. The main thing you have to ensure is that you are available (with enough money) to take the trades.

--SwingTrader
Good Going Swing Trader !! Excellent !!
 
#23
swingtrader said:
Nihar,

Here is what I can advise you:

1. As Traderji rightly pointed out above - make sure you are trading with the market's current trend. Since the market is currently in a downtrend you may not get quality buying opportunities.

2. For trends at first begin looking at two EMAs (this is the way I started studying) . Or you could use the method extremely well explained by Traderji - Guppy moving averages. Select any one method of identifying trends and stick to it.

3. Once a trend is well established in a stock then you can look at various oscillators (again select any one and stick to it) and enter a trade based on their levels (don't get bogged down with absolute levels of the oscillators, just see if they are approximately overbought or oversold). Eg. Buy when the oscillator is oversold in an established uptrend or Short when the oscillator is overbought in a downtrend. And in both cases make sure you get confirmation from the price itself before you enter the trade. It means, when the prices are oversold in an uptrend, wait for the price to start moving up before you buy & vice versa.

Let me give you an example so it is clearer. Let us take your example - Ranbaxy. In the attached Ranbaxy chart we'll use 20 & 50 EMAs to identify the trend. This would mean Ranbaxy was in an uptrend approx from Sep 13 2004 to Jan 17 2005. For the oscillator we'll use Stochastics (5,3). You will see that in the uptrend you had three oversold conditions where you could have bought - approx around Oct 11th, Oct 26th & Nov 26th. Further, Ranbaxy went into a downtrend around Jan 17th and is still in a downtrend (so no wonder you are not getting buying opportunities). In the downtrend you had two overbought conditions to short Ranbaxy - approx around Feb 1st 2005 & Mar 13th 2005.

Also the most important thing to plan before you enter trades is where your stop loss point will be and how you will exit the trades to take profits. There are many strategies you can use. I will try and post something on it later.

I hope this will give your thinking a boost. Finally you will have to come up with trading strategies that you are comfortable with using whatever indicators you like. Make sure you use minimum number of indicators (at the most two should be more than enough).

--SwingTrader
I am really learning arts of successful trading
 
#25
:D
SwingTrader - Nice work!
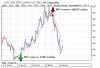
everyone should print and re-read everything you've written thus far. I'm including a chart of Lumber (US Commodity) to illustrate using the Moving Averages for Trends and "entry/exit" points.

Some will argue that I could have had a "better price", but to me, such statements are hindsight. No one knows tomorrow's prices and duration, and because I have already established my risk tolerance, I don't mind market orders with a trailing stop the moment the moving averages crosses.

No matter what you use (some are better than others), there is no avoiding drawdowns, Gaps, and whipsaws - unless you decide to never trade at all. Not every commodity is always trending. Sometimes it's rangebound with frequent whipsaws. So be it. On average, the average wins, and since the prices have only 3 directions available, each 33.3% probable, it is likely that as the trend continues for any length of time, just when you're about to "bail out", the trend usually ends/changes.

Don't take that to mean that you should continue in losses. On the contrary...cut losses early and let profits accumulate. It's usually the sideways rangebound instances that lead to whipsaws and frustration.

We're human which is fancy for "emotional". Fine, but develop a strategy/method/formula for removing your emotions from becoming a market force. Cry, whine, and pewk if need be, but stick to the plan. Just be sure your plan cuts losses, allows profits to accumulate, and always assess your risk tolerance.

Hope this helped.
MasterChief
 

Attachments

#26
About Stop Loss Exits for the above system

When you enter trades there will always be failed trades, that is part of trading. The main thing to ensure here is that you don't lose too much and have more than enough capital for taking the next trade that fits your criteria.

In the attached Ranbaxy chart I have pointed out one additional trade that failed when the uptrend finally ended. Stop loss order is required on each trade to ensure you don't lose too much on failed trades. This decision has to be made before you enter the trade and the stop loss order should be put in as soon as you enter a trade.

There are many types of stop loss exits but I won't go into them here (I will go into detail later in a different thread). The idea here is to keep it simple.

Fixed Amount based Stop Loss: You can put a stop order based on the maximum amount you are prepared to lose on a single trade. It is suggested that this amount shouldn't generally be more than 2% of your total account equity. This type of stop should probably be avoided because there is no rationale behind this type of exit.

Recent Short Term Support: For the system we are discussing it makes sense to place a stop order few ticks below the recent swing low/high. This is because we expect the price to move in our favour after we have entered the trade, so if it doesn't and it moves past the recent swing low/high then the reason to enter the trade has been defeated so it is best to get out of the trade. I have pointed out such stops in the attached chart with a small orange colored bars.

The above suggested stop is very simplistic but makes sense for the type of trade we are entering. There are many other good stop loss strategies based on ATR (Avg True Range) multiples & MAE (Maximum Adverse Excursion) but the discussion would have got really complex. I will post these with examples in another thread.

Always take stop losses, there will be many good trades available to take later. The main thing you have to ensure is that you are available (with enough money) to take the trades.

--SwingTrader

how to use this method in intraday i use 30 min chart to see downtrend/uptrend and use 5 min chart to trade.. with stoch and rsi but i am still having trouble to find stop loss,entry and exist:annoyed::confused::confused: . i use spider iris software for tick by tick intraday...
please help swing trader be intraday trader from swing for sometime.. thanks
 

Similar threads