


Dear SwingTrader,
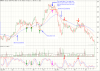
Can you tell me which Software you used to produce the above Chart. I am badly in need of a good software to go ahead.
I am a junior Trader and still learning how to analysie charts. Your writeup has helped to learn some more new things.
waiting for your reply...
Thanks Again...
Satya
Can you tell me which Software you used to produce the above Chart. I am badly in need of a good software to go ahead.
I am a junior Trader and still learning how to analysie charts. Your writeup has helped to learn some more new things.
waiting for your reply...
Thanks Again...
Satya
")