Hello happy ji..
I need help in exploration...
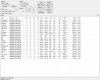
When am Exploring in Live market... Scripts not coming in realtime as time shown in Exploration..(coming late)
Need help so scripts get explore on time...
Thanx you in advance
Formula for AFL below
_SECTION_BEGIN("EMA");
Range1=Optimize("range1",13,1,20,1);
Range2=Optimize("range2",34,1,125,1);
Buy=Cover = Cross((EMA(Close,range1)),(EMA(Close,range2)));
Sell =Short= Cross(EMA(Close,range2),(EMA(Close,range1)));
//Short = Sell;
Buy = Cross((EMA(Close,range1)),(EMA(Close,range2)));
Sell = Cross(EMA(Close,range2),(EMA(Close,range1)));
Short=Cover=0;
AlertIf( Buy, "SOUND C:\\Windows\\Media\\notify.wav", "Audio alert", 2 );
AlertIf( Sell, "SOUND C:\\Windows\\Media\\tada.wav", "Audio alert", 2 );
// plot expanded average
Plot(EMA( Close,range1), "MV1", colorBlue );
Plot(EMA( Close,range2), "MV2", colorRed );
// plot arrows
shape = Buy * shapeUpArrow + Sell * shapeDownArrow;
PlotShapes( shape, IIf( Buy, colorBlue, colorRed ), 0, IIf( Buy, Low, High ) );
_SECTION_END();
Filter =1;
Filter = Buy OR Sell;
AddColumn(Buy,"Buy",1);
AddColumn(Sell,"Sell",1);
_SECTION_BEGIN("Price1");
SetChartOptions(0,chartShowArrows|chartShowDates);
_N(Title = StrFormat("{{NAME}} - {{INTERVAL}} {{DATE}} Open %g, Hi %g, Lo %g, Close %g (%.1f%%) {{VALUES}}", O, H, L, C, SelectedValue( ROC( C, 1 ) ) ));
Plot( C, "Close", ParamColor("Color", colorYellow ), styleNoTitle | ParamStyle("Style") | GetPriceStyle() );
_SECTION_END();
_SECTION_BEGIN("RSI Divergence");
//------------------------------------------------------------------------------
//
// Formula Name: RSI Divergence
// Level: medium
// Flags: indicator
// Formula URL:
// Details URL:
//
//------------------------------------------------------------------------------
//
// + scanner
//
//------------------------------------------------------------------------------
/*---------------------------------------------------
RSI Divergence
--------------------------------------------------------*/
GraphXSpace=7;
n=Param("% Reverse ",20,0,100,1);
Buy=Sell=0;
Var = Zig(RSI(), n);
t= Trough(RSI(), n, 1);
p= Peak(RSI(), n, 1);
x[0] =Var[0];
price[0] = C[0];
j=0;
// bearish divergence
for ( i=0; i<BarCount; i++)
{
if(Var
== p)
{
j++;
x[j] =Var;
price[j] =C;
if(x[j] <x[j-1] && price[j-1]< price[j])
Sell =1;
}
}
// bullish divergence
for ( i=0; i<BarCount; i++)
{
if(Var == t)
{
j++;
x[j] =Var;
price[j] =C;
if(x[j] >x[j-1] && price[j]<price[j-1])
Buy =1;
}
}
Plot(Var, "", 39);
PlotShapes ( IIf(Sell, shapeSmallCircle, shapeNone), colorRed, 0 , Var,0);
PlotShapes( IIf(Buy, shapeSmallCircle, shapeNone), colorBrightGreen, 0, Var,0);
Title ="RSI Divergence" ;
_SECTION_END();
_SECTION_BEGIN("TEMA");
P = ParamField("Price field",-1);
Periods = Param("Periods", 15, 2, 200, 1, 10 );
Plot( TEMA( P, Periods ), _DEFAULT_NAME(), ParamColor( "Color", colorCycle ), ParamStyle("Style") );
_SECTION_END();
Filter =1;
Filter = Buy OR Sell;
AddColumn(Buy,"Buy",1);
AddColumn(Sell,"Sell",1);
Buy = Open == Low;
Sell = Open == High;
Noise = High > Close;
AddColumn(Open,"Open");
AddColumn(Close,"Close");
AddColumn(High,"High");
AddColumn(Low,"Low");
Filter= (Buy OR Sell) AND Noise;
AddColumn(IIf(Buy,Open,Null)," open=low ", 6.2,1.2,colorGreen);
AddColumn(IIf(Sell,Open,Null)," open= high ",6.2,1.2,colorOrange);
Q = Param( "% Change", 2, 0.1, 10, 0.1 );
Z = Zig( C , q ) ;
HH = ( ( Z < Ref( Z, -1 ) AND Ref( Z, -1 ) > Ref( Z, -2 ) ) AND (Peak( z, q, 1 ) > Peak( Z, q, 2 ) ) );
LH = ( ( Z < Ref( Z, -1 ) AND Ref( Z, -1 ) > Ref( Z, -2 ) ) AND (Peak( Z, q, 1 ) < Peak( Z, q, 2 ) ) );
HL = ( ( Z > Ref( Z, -1 ) AND Ref( Z, -1 ) < Ref( Z, -2 ) ) AND (Trough( Z, q, 1 ) > Trough( Z, q, 2 ) ) );
LL = ( ( Z > Ref( Z, -1 ) AND Ref( Z, -1 ) < Ref( Z, -2 ) ) AND (Trough( Z, q, 1 ) < Trough( Z, q, 2 ) ) );
GraphXSpace = 5;
dist = 0.5 * ATR( 20 );
for ( i = 0; i < BarCount; i++ )
{
if ( HH )
PlotText( "HH", i, H[ i ] + dist, colorRed );
if ( LH )
PlotText( "LH", i, H[ i ] + dist, colorRed );
if ( HL )
PlotText( "HL", i, L[ i ] - dist, colorBrightGreen );
if ( LL )
PlotText( "LL", i, L[ i ] - dist, colorBrightGreen );
}
Filter=HH OR HL OR LH OR LL;
AddColumn(RSI(2),"RSI",1.2);
AddColumn(Close,"PRICE",1.2);
AddColumn(HH,"HH");
AddColumn(LH,"LH");
AddColumn(HL,"HL");
AddColumn(LL,"LL");
AddColumn(V,"volume",1.0);
AddColumn (ADX(), "ADX", 1.2 );


")