Simple Coding Help - No Promise.

Hi AFL Expert seniors..

i have doubt and need..

is there any solution in amibroker while my chart time frame change 1 min to 5min time frame, my indicator should be disappear..?

for example.. i have 50 ema & 200 ema on 1 min chart ,ff i change 5 min chart, i don't need 50 ema ,200 ema only shown in 5 min chart

is it possible?

pls help...:finger:
 

yusi

Well-Known Member
is there any solution in amibroker while my chart time frame change 1 min to 5min time frame, my indicator should be disappear..?

for example.. i have 50 ema & 200 ema on 1 min chart ,ff i change 5 min chart, i don't need 50 ema ,200 ema only shown in 5 min chart
Interval() ? For example to show EMA when less than M5:

Code:
if (Interval() < 600) {
    Plot(EMA(C, 50), _DEFAULT_NAME(), colorYellow); 
}
 

checkmate7

Well-Known Member
Hi yusi ji,after long time see you..
hope do well..
s, above code work <600 but not > 1800(15 min)..
pls illustrate with example...

Happy trading....
optionwriter Sir, You can try this code, its a small variation of Yusi-ji's code. Please note we are saying here that ema50 is visible below the defined time frame and not above that time frame. You can define your time frames in parameters window.

Code:
intratmfrm  = Param( "EMA50 Hide After (minutes TF)", 5, 1, 1440, 1 ) * 60;

if (Interval() < intratmfrm)
{
    Plot(EMA(C, 50), _DEFAULT_NAME(), colorGreen,styleLine|stylethick);
}
 
raj_jain1 Sir, I have attempted this afl but please check. I don't have data to check for longer timeframes. This will plot circle (green for HHH and red of LLL) and will also explore. You can do for monthly|weekly|daily and intraday by selecting from the parameters. My apologies, but my understanding is very limited. Thanks.

Code:
_SECTION_BEGIN("Max 3 Months High Low with Exploration");

SetChartOptions(0,chartShowArrows|chartShowDates);
_N(Title = StrFormat("{{NAME}} - {{INTERVAL}} {{DATE}} Open %g, Hi %g, Lo %g, Close %g (%.1f%%) {{VALUES}}", O, H, L, C, SelectedValue( ROC( C, 1 ) ) ));
Plot( C, "Close", ParamColor("Color", colorDefault ), styleNoTitle | ParamStyle("Style") | GetPriceStyle() );

EODTF = Paramlist("TF Monthly|Weekly|Daily","Monthly|Weekly|Daily",0);
MultiTF = ParamList( "EOD or Intraday", "EOD|Intraday", 0 );
intratmfrm  = Param( "Input Intra-day TF (minutes)", 60, 1, 1440, 1 ) * 60;
expandmode  = Paramtoggle("Expand First or Last", "expandFirst|expandLast",0);


switch( EODTF )
{
    case "Monthly": EODTF = inMonthly; break;
    case "Weekly":  EODTF = inWeekly;  break;
    case "Daily":   EODTF = inDaily;   break;

}


switch(MultiTF)
{
case "Intraday":
HM1 = TimeFrameGetPrice( "H", intratmfrm,-1,expandmode);
HM2 = TimeFrameGetPrice( "H", intratmfrm,-2,expandmode);
HM3 = TimeFrameGetPrice( "H", intratmfrm,-3,expandmode);
LM1 = TimeFrameGetPrice( "L", intratmfrm,-1,expandmode);
LM2 = TimeFrameGetPrice( "L", intratmfrm,-2,expandmode);
LM3 = TimeFrameGetPrice( "L", intratmfrm,-3,expandmode);
break;

case "EOD":
HM1 = TimeFrameGetPrice( "H", EODTF,-1,expandmode);
HM2 = TimeFrameGetPrice( "H", EODTF,-2,expandmode);
HM3 = TimeFrameGetPrice( "H", EODTF,-3,expandmode);
LM1 = TimeFrameGetPrice( "L", EODTF,-1,expandmode);
LM2 = TimeFrameGetPrice( "L", EODTF,-2,expandmode);
LM3 = TimeFrameGetPrice( "L", EODTF,-3,expandmode);
break;

}


ThisMonthHigh = (H>HM1 AND H>HM2 AND H>HM3);
ThisMonthLow = (L<LM1 AND L<LM2 AND L<LM3);

ThisMonthHigh = ExRem(ThisMonthHigh, ThisMonthLow);
ThisMonthLow = ExRem(ThisMonthLow, ThisMonthHigh);

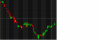
PlotShapes(ThisMonthHigh*shapeSmallCircle,colorGreen,0,L,-15);
PlotShapes(ThisMonthLow*shapeSmallCircle,colorred,0,H,15);

Filter = ThisMonthHigh OR ThisMonthLow;

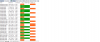
AddTextColumn( Interval(2), "Set Interval", 1 );
AddColumn(C, "Price", 1.2, colorWhite, IIf(ThisMonthHigh==True, colorgreen, IIf(ThisMonthLow==True,colorOrange,colorwhite)), colorwhite, 120);

AddColumn(ThisMonthHigh, "Month High", 1, colorWhite, IIf(ThisMonthHigh==True, colorgreen, colorwhite),120);
AddColumn(ThisMonthLow, "Month Low", 1, colorWhite, IIf(ThisMonthLow==True,colorOrange,colorwhite),120);


_SECTION_END();
sir its showing error ...
 

Attachments

rmike

Well-Known Member
for example.. i have 50 ema & 200 ema on 1 min chart ,ff i change 5 min chart, i don't need 50 ema ,200 ema only shown in 5 min chart
Seriously!!!

Guys there's simply no excuse for not reading up on params of basic provided function(s)!!!!

Ignorance of these basics leads to needless convoluted inefficient codes!!!

All it requires is using the input params provided in the Plot function itself!!!

Since it's just a single line & fits the bill of Simple Coding Help, hence ........

Code:
Plot( EMA( C, 50 ), "EMA50", colorAqua, IIf(Interval() == 5*in1Minute, styleNoDraw, styleLine));
 

Similar threads