


Simple Coding Help - No Promise.
- Thread starter Happy_Singh
- Start date
Hi, coding expert friends.....
I want little help to code a simple strategy for backtest for Nifty and Banknifty futures.
Timeframe = 15 min (intraday)
Condition for trade__ First 15 min bar High > Previous day High OR First 15 min bar Low < Previous day Low
Entry__ If above condition satisfied, then Buy order above First 15min bar High + 2 points (filter) and Sell order below First 15 min bar Low - 2 points (filter), whichever triggers first, opposite side order will be Stop Loss.
Exit__ either stop loss hit or exit at 3:15 pm.
(actually this is a conditional ORB strategy which i manually backtested for 6 months data and results are encouraging so want to backtest it for 6-7 year data. I have amibroker v 5.3 only)
Thanks
Hi, I am new to Amibroker and have a rookie question. When you scroll the chart AFTER SELECTING A BAR IN THE CHART the close value printed in 2nd trace command (seebelow code) changes. So all signals that use Ref(C, -1) also disappear/reappear on scroll. is there a workaround? my code does not use loops and i would like to keep it that way.
Code:
SetBarsRequired(sbrAll);
_SECTION_BEGIN("Price");

SetChartOptions(0,chartShowArrows|chartShowDates|chartWrapTitle);
_N(Title = StrFormat("{{NAME}} - {{INTERVAL}} {{DATE}} Open %g, Hi %g, Lo %g, Close %g (%.1f%%), FCD %g {{VALUES}} ", O, H, L, C, SelectedValue( ROC( C, 1 ))/*, futureCloudDirection */) );
Plot( C, "Close", ParamColor("Color", colorDefault ), styleNoTitle | ParamStyle("Style") | GetPriceStyle(), Null, Null, 0, 1, 1);

_SECTION_END();
_TRACE("C[100]="+C[100]);
_TRACE("Ref(C, -1)="+Ref(C, -1));
Last edited:
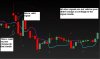
Hi Friends,
Can somebody create a scan/explorer for this amibroker AFL.
Conditions to be fullfilled :
Buy ::: When Buy arrow comes the psar should be below the candle. Important : It should have changed to green dot only at the respective Buy candle.
Sell :: When Sell arrow comes the psar should be above the candle. It should have changed to red dot above the candle only at the respective sell signal candle and not before that.
It should fulfill these conditions for scan and just buy/sell arrow should not come in scan or explore option.
Thanks a lot .. Attached a pic with explanation
Code:
_SECTION_BEGIN("SYSTEM");
SetBarsRequired(1000000, 1000000);
SetChartOptions(2,chartShowArrows|chartShowDates);
SetTradeDelays(0,0,0,0);

period  = Param("Period", 10, 1, 240, 1);
mult    = Param("Multiplier", 1.3, 1, 240, 0.1);
showPrice  = ParamToggle("Show Price","No|yes",1);
showArrows = ParamToggle("Show Arrows","No|yes",1);
//showRibbon = ParamToggle("Show Ribbon","No|yes",1);

f=ATR(period);

VS[0] = Close[0];
trend[0] = 0;
HighC[0]=0;
Lowc[0]=0;


for( i = period+1; i < BarCount; i++ )
{

  vs[i] = vs[i-1];
  trend[i]  = trend[i-1];
  highC[i]  = HighC[i-1];
  lowc[i]   = lowc[i-1];

    if ((trend[i]>=0) && ( C[i] <VS[i] ))
    {
            trend[i] =-1;
            HighC[i] = C[i];
            lowc[i] = C[i];
    }

    if ((trend[i]<=0) && (C[i] >VS[i]))
    {
            trend[i]=1;
            HighC[i] = C[i];
            lowc[i] = C[i];
    }

    if (trend[i]==-1)
    {
        if (C[i]<lowc[i]) lowc[i] = C[i];
     VS[i]= lowc[i]+ (mult*f[i]);
    }


    if (trend[i]==1)
    {
        if (C[i]>HighC[i]) HighC[i] = C[i];
     VS[i]= HighC[i]-(mult*f[i]);
    }

}


Buy=Cross(Trend,0);
Sell=Cross(0, Trend);
Short = Sell;
Cover = Buy;

if (ShowPrice) Plot(Close,"Close",colorBlack,styleCandle);
Plot(VS, "Vol Stop",IIf(trend==1,10,11 ),styleThick);

mkol    = IIf( Trend==1, 10,  11);
//if (ShowRibbon) Plot(5, "ribbon", mkol, styleOwnScale|styleArea|styleNoLabel|styleNoTitle, 0, -5);

shape = Buy * shapeUpArrow + Sell* shapeDownArrow;
if (ShowArrows) PlotShapes( shape, IIf( Buy, colorGreen, colorRed ), 0, IIf( Buy, Low-f, High+f));
//AlertIf( Buy, "SOUND C:\\Windows\\Media\\timeout.wav", "Sell " + C,2,1+2,1);
//AlertIf( Sell, "SOUND C:\\Windows\\Media\\timeout.wav","Buy " + C,1,1+2,1);

 accel = Param("Acceleration", 0.011, 0, 1, 0.001);
 mx = Param("Max. acceleration", 0.101, 0, 1, 0.001);

 f_sar = SAR(accel,mx);

 colordots = IIf(f_sar < L,colorBrightGreen,IIf( f_sar >
 H,colorRed,colorWhite));

 Buy = Cross(H,f_sar); Buy = Ref(Buy,-1); BuyPrice = O;
 Sell = Cross(f_sar,L); Sell = Ref(Sell,-1); SellPrice = O;

 SetBarsRequired(-2,-2);
 SetChartOptions(0, chartShowDates);
 Plot(C,"\nClose",colorWhite,64);
 Plot(f_sar,"\nf_sar",colordots,styleDots|styleNoLine);

 //PlotShapes(IIf(Buy,shapeUpArrow,shapeNone),colorGreen,0,L,-15);
// PlotShapes(IIf(Buy,shapeHollowUpArrow,shapeNone),colorWhite,0,L,-15);


// PlotShapes(IIf(Buy,shapeHollowSmallCircle,shapeNone),colorWhite,0,BuyPrice,0);


// PlotShapes(IIf(Sell,shapeDownArrow,shapeNone),colorRed,0,H,-15);
 //PlotShapes(IIf(Sell,shapeHollowDownArrow,shapeNone),colorWhite,0,H,-15);


//PlotShapes(IIf(Sell,shapeHollowSmallCircle,shapeNone),colorWhite,0,SellPrice,0);
SetChartBkColor(3 ) ;


_SECTION_END();

_SECTION_BEGIN("Name");
GfxSetOverlayMode(1);
GfxSelectFont("Tahoma", Status("pxheight")/6 );
GfxSetTextAlign( 6 );// center alignment
GfxSetTextColor( ColorHSB( 43, 43, 73 ) );
GfxSetBkMode(0); // transparent
GfxTextOut( Name(), Status("pxwidth")/2, Status("pxheight")/12 );
GfxSelectFont("Tahoma", Status("pxheight")/22 );


GfxSelectFont("Tahoma", Status("pxheight")/28 );
GfxSelectFont("Tahoma", Status("pxheight")/26 );
GfxTextOut( "", Status("pxwidth")/2, Status("pxheight")/3 );
_SECTION_END();

_SECTION_BEGIN("Price");
SetChartOptions(0,chartShowArrows|chartShowDates);
    SetChartBkColor(ParamColor("Outer Panel",colorPaleBlue));
    SetChartBkGradientFill(ParamColor("Upper Chart",1),ParamColor("Lower Chart",23));
    GraphXSpace=Param("GraphXSpace",10,0,100,1);
    dec = (Param("Decimals",2,0,7,1)/10)+1;
    bi = BarIndex();
    Lbi = LastValue(BarIndex());
    sbi = SelectedValue(bi);
    x1= BarCount-1;
Title = EncodeColor(55)+  Title = Name() + "     " + EncodeColor(32) + Date() +
"      " + EncodeColor(5) + "{{INTERVAL}}  " +
    EncodeColor(55)+ "     Open = "+ EncodeColor(52)+ WriteVal(O,dec) +
    EncodeColor(55)+ "     High = "+ EncodeColor(5) + WriteVal(H,dec) +
    EncodeColor(55)+ "      Low = "+ EncodeColor(32)+ WriteVal(L,dec) +
    EncodeColor(55)+ "    Close = "+ EncodeColor(52)+ WriteVal(C,dec)+
    EncodeColor(55)+ "    Volume = "+ EncodeColor(52)+ WriteVal(V,1);

_SECTION_END();
Attachments
-
 44.2 KB Views: 56
hello,
I am new to amibroker. Is it possible to plot hourly MA in daily chart?. If possible please help with the afl code
I am new to amibroker. Is it possible to plot hourly MA in daily chart?. If possible please help with the afl code
TimeFrameSet(inHourly);
// Code for Moving Average like this
Plot( MA( CLOSE, 12 ), _DEFAULT_NAME(), ParamColor( "Color", colorCycle ), ParamStyle("Style") );
TimeFrameRestore();
Similar threads
-
Convert Simple Thinkscript Support/Resistance Lines into AFL
- Started by StockTempest
- Replies: 4
-
-
Coding help.........adding exploration for the simple combo
- Started by praveen5344
- Replies: 2
-
Help with simple coding...........SUPERTREND AND STOCHASTICS
- Started by praveen5344
- Replies: 3
-