


Simple Coding Help - No Promise.
- Thread starter Happy_Singh
- Start date
I have one request.
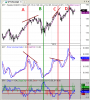
does anyone has pivot alf which can just show daily levels on the intraday basis only.
same like in image
I think this AFL is quite close to what you are referring to...
http://tradecatcher.blogspot.in/2017/05/pivot-points-amibroker-afl.html
http://tradecatcher.blogspot.in/2017/05/pivot-points-amibroker-afl.html
I think this AFL is quite close to what you are referring to...
http://tradecatcher.blogspot.in/2017/05/pivot-points-amibroker-afl.html
http://tradecatcher.blogspot.in/2017/05/pivot-points-amibroker-afl.html
only intraday plotting keeps charts clean and don't make them messy
Please Help me to find this afl
Please Help me to find this afl
I found a picture on this one website that is in google. But did not find txt. Of the afl.
In my opinion this afl is very good to see the fake price movement so that can support buy and sell decision and also. However, the problem is I can not create or know the background of the afl. If pleasent, please help so afl this also be a blessing in need. Thank you for the help.
Thank you very much
Attachments
-
 36.7 KB Views: 97
i want to scan all stocks with arranging top 10 volume based for the following rules
* display stocks which EMA 13 > EMA 34 > SMA 200 on daily basis , top 10 stocks with by over min.2
times the average volume over the past 10 trading sessions and have lost more than 3% today
* display stocks which EMA 13 < EMA 34 < SMA 200 on daily basis , top 10 stocks with by over min.2
times the average volume over the past 10 trading sessions and have lost more than 3% today
Hello Friends ")
A small help needed in following Renko Afl code giving some errors .
A small help needed in following Renko Afl code giving some errors .
Code:
//------------------------------------------------------------------------------
//
//  Plot renko chart. Error in plotting will occur if the box and/or reversal
//  values are too small causing the number of renko bars exceeding the
//  underlying stock normal price bars
//
//------------------------------------------------------------------------------

// Renko  Chart
// Graham Kavanagh  13 Aug 2004 ver C
// Custom Indicator, date axis does not apply

SetBarsRequired(10000,10000);

// Brick size is dependant on what you want, if too small will not produce a chart due to insufficient x-axis bars
//Brick = LastValue( ATR(100) );
//Brick = LastValue( Max(0.02*C, 0.05) );
Brick = Param( "Brick Size", 0.1, 0.01, 1.00, 0.01 );
reverse = 2;

// Convert the closing price to rising and falling rounded bricks
CF = ceil(C/Brick);
CR = floor(C/Brick);

// initialize first element
j = 0;
RKC[j] = CF[0];
RKO[j] = CF[0] + 1;

down[j] = 1;  // By default the first bar is a down bar.
up[j] = 0;

// Loop to produce the Renko values in number of bricks

for( i=1; i<BarCount-1; i++ )
{
if( CF[i] <= RKC[j] - 1 && down[j] ) // Continue down
	{
		num = RKC[j] - CF[i];
		for( x=1; x<=num; x++ )
		{
			j++;
			up[j] = 0;
			down[j] = 1;
			RKC[j] = RKC[j-1] - 1;
			RKO[j] = RKC[j] + 1;
		}
	}
	else
	{
		if( CR[i] >= RKC[j] + Reverse && down[j] )  // Change down to up
		{
			num = CR[i] - RKC[j];
			j++;
			up[j] = 1;
			down[j] = 0;
			RKC[j] = RKC[j-1] + 2;
			RKO[j] = RKC[j] - 1;
			for( x=2; x<=num; x++ )
			{
				j++;
				up[j] = 1;
				down[j] = 0;
				RKC[j] = RKC[j-1] + 1;
				RKO[j] = RKC[j] - 1;
			}
		}
		else
		{
			if( CR[i] >= RKC[j] + 1 && up[j] ) // Continue Up
			{
				num = CR[i] - RKC[j];
				for( x=1; x<=num; x++ )
				{
					j++;
					Up[j] = 1;
					Down[j] = 0;
					RKC[j] = RKC[j-1] + 1;
					RKO[j] = RKC[j] - 1;
				}
		 	}
		 	else
		 	{
			 	if( CF[i] <= RKC[j] - Reverse && up[j] )  // Change up to down
			 	{
				 	num = RKC[j] - CF[i];
				 	j++;
					Up[j] = 0;
				 	Down[j] = 1;
				 	RKC[j] = RKC[j-1] - 2;
				 	RKO[j] = RKC[j] + 1;
				 	for( x=2; x<=num; x++ )
				 	{
					 	j++;
					 	up[j] = 0;
				 		down[j] = 1;
				 	 	RKC[j] = RKC[j-1] - 1;
				 	 	RKO[j] = RKC[j] + 1;
					}
				}
			}
		}
	}
}

// move the chart to right end of chart space, ie last brick on last bar position
delta =  BarCount-1 - j;

RKC = Ref( RKC, -delta );
RKO = Ref( RKO, -delta );

Up = Ref( Up, -delta );
Down = Ref( Down, -delta );

/*
rC = RKC * Brick;// + (Up-down)*Brick/2;
rO = RC - (Up-down)*Brick;
rH = Max(rC,rO);
rL = Min(rC,rO);
*/

C = RKC * Brick;// + (Up-down)*Brick/2;
O = C - (Up-down)*Brick;
H = Max(C,O);
L = Min(C,O);

Plot( C, "", colorGrey50,styleCandle);
// plot chart
//plotOHLC( rO, rH, rL, rC, "Renko Price " , colorBlack, styleCandle);
GraphXSpace=5;

Title = Name() + " - {{INTERVAL}} {{DATE}} - Renko Chart : Last Value = " + RKC * Brick + ", Brick Size = " + Brick;Re: Please Help me to find this afl
(http://www.traderji.com/members-discussion-forums/100149-my-journey-technical-analysis-8.html)
Profitable trading does not depend on the knowledge of large number of theories,rather it depends on successful implementation of Few....Explained by Sunil Minglani in conversation with Sumit Agrawal
https://www.youtube.com/watch?v=eEuBC1abQ1c
may be you get your answer
Please Help me to find this afl
I found a picture on this one website that is in google. But did not find txt. Of the afl.
In my opinion this afl is very good to see the fake price movement so that can support buy and sell decision and also. However, the problem is I can not create or know the background of the afl. If pleasent, please help so afl this also be a blessing in need. Thank you for the help.
Thank you very much
(http://www.traderji.com/members-discussion-forums/100149-my-journey-technical-analysis-8.html)
Profitable trading does not depend on the knowledge of large number of theories,rather it depends on successful implementation of Few....Explained by Sunil Minglani in conversation with Sumit Agrawal
https://www.youtube.com/watch?v=eEuBC1abQ1c
may be you get your answer
Re: Please Help me to find this afl
Lekin, 99% ko to.. wo hi to problem hai, bhai...
Suk..Sess..full implementation..
Suk..Sess..full implementation ka chakkar main to na jane kitna trader barbad ho gaya...abhi bhi ho raha hai..
Suk..Sess..full implementation kaise hota hai? koi likh ke to bata na sake... sab bari bari baat, sab maya hai.. :lol:
-----------
agar trade karte karte... ek din.. market ke sath sath..price action react karna sikh jao, to kam pe ayega...
There is the difference between analyst and traders...bari bari baat analyst karte hai..and paper traders...
real traders know market is uncertain, but they can make money either way... without predicting the movement.. just reacting on it..is enough..
(http://www.traderji.com/members-discussion-forums/100149-my-journey-technical-analysis-8.html)
Profitable trading does not depend on the knowledge of large number of theories,rather it depends on successful implementation of Few....Explained by Sunil Minglani in conversation with Sumit Agrawal
https://www.youtube.com/watch?v=eEuBC1abQ1c
may be you get your answer
Profitable trading does not depend on the knowledge of large number of theories,rather it depends on successful implementation of Few....Explained by Sunil Minglani in conversation with Sumit Agrawal
https://www.youtube.com/watch?v=eEuBC1abQ1c
may be you get your answer
Suk..Sess..full implementation..
Suk..Sess..full implementation ka chakkar main to na jane kitna trader barbad ho gaya...abhi bhi ho raha hai..
Suk..Sess..full implementation kaise hota hai? koi likh ke to bata na sake... sab bari bari baat, sab maya hai.. :lol:
-----------
agar trade karte karte... ek din.. market ke sath sath..price action react karna sikh jao, to kam pe ayega...
There is the difference between analyst and traders...bari bari baat analyst karte hai..and paper traders...
real traders know market is uncertain, but they can make money either way... without predicting the movement.. just reacting on it..is enough..
Last edited:
Similar threads
-
Convert Simple Thinkscript Support/Resistance Lines into AFL
- Started by StockTempest
- Replies: 4
-
-
Coding help.........adding exploration for the simple combo
- Started by praveen5344
- Replies: 2
-
Help with simple coding...........SUPERTREND AND STOCHASTICS
- Started by praveen5344
- Replies: 3
-