


Simple Coding Help - No Promise.
- Thread starter Happy_Singh
- Start date

Hi and Thanks coder
can anyone optimize or update this code for amibroker 6 and upper with iir and other new function
Thanks
Adaptive macd
can anyone optimize or update this code for amibroker 6 and upper with iir and other new function
Thanks
Adaptive macd
Code:
//A new MACD Indicator KMACD Version V.1.0
// By Karthik Marar - www.karthikmarar.blogspot.com
// Public release for personal use only.
//Please do not commercialize this indicator in its original or modified form
_SECTION_BEGIN("Dominant Period");

    SetBarsRequired( 1000, 1000);
    prc = ( High + Low ) / 2;
    Cyclepart = 0.7 ;
    pi=4*atan(1);
    RTD=180/pi;
    DTR=pi/180;

    Smooth[0] = Detrender[0] = I1[0] = Q1[0] = jI[0] = jQ[0] = I2[0] = I3[0] = Q3[0] = Q2[0] = Re[0] = Re1[0] =Im[0] = Im1[0] = 0;
    Period[0] = Period1[0] = alpha = cycle = SmoothPeriod[0] = imagpart[0] = realpart[0] = DCPhase[0] = 0;
    for ( i = 6; i < BarCount; i++ )
    {
    Smooth[i] = ( 4 * prc[i] + 3 * prc[i-1] + 2 * prc[i-2] + prc[i-3] ) / 10;
    Cycle[i] = ((1-0.5*alpha[i])^2)*(Smooth[i] - 2*Smooth[i-1] + Smooth[i-2]) + 2*(1-alpha[i])*Cycle[i-1] - ((1-alpha[i])^2)*Cycle[i-2];
    AmpCorr[i] = 0.075 * Period[i-1] + 0.54;
    Detrender[i] = ( 0.0962 * Smooth[i] + 0.5769 * Smooth[i-2] - 0.5769 * Smooth[i-4] - 0.0962 * Smooth[i-6] ) * AmpCorr[i];
    Q1[i] = ( 0.0962 * Detrender[i] + 0.5769 * Detrender[i-2] - 0.5769 * Detrender[i-4] - 0.0962 * Detrender[i-6] ) * AmpCorr[i];
    I1[i] = Detrender[i-3];
    jI[i] = ( 0.0962 * I1[i] + 0.5769 * I1[i-2] - 0.5769 * I1[i-4] - 0.0962 * I1[i-6] ) * AmpCorr[i];
    jQ[i] = ( 0.0962 * Q1[i] + 0.5769 * Q1[i-2] - 0.5769 * Q1[i-4] - 0.0962 * Q1[i-6] ) * AmpCorr[i];
    I2[i] = I1[i] - jQ[i];
    Q2[i] = Q1[i] + jI[i];
    I3[i] = 0.2 * I2[i] + 0.8 * I3[i-1];
    Q3[i] = 0.2 * Q2[i] + 0.8 * Q3[i-1];
    Re[i] = I3[i] * I3[i-1] + Q3[i] * Q3[i-1];
    Im[i] = I3[i] * Q3[i-1] - Q3[i] * I3[i-1];
    Re1[i] = 0.2 * Re[i] + 0.8 * Re1[i-1];
    Im1[i] = 0.2 * Im[i] + 0.8 * Im1[i-1];
    {
    if ( Im1[i] != 0 AND Re1[i] != 0 )    Period1[i] = 360*DTR / atan( Im1[i] / Re1[i] );
    else
    Period1[i] = Period1[i-1];
    }
    {
    if ( Period1[i] > 1.5 * Period1[i-1] )  Period2[i] = 1.5 * Period1[i-1];
    else
    {
    if ( Period1[i] < 0.67 * Period1[i-1] ) Period2[i] = 0.67 * Period1[i-1];
    else
    Period2[i] = Period1[i];
    }
    }
    {
    if ( Period2[i] < 6 )    Period3[i] = 6;
    else
    {
    if ( Period2[i] > 50 )   Period3[i] = 50;
    else
    period3[i]=Period2[i];
    }
    }
    Period[i] = 0.2 * Period3[i] + 0.8 * Period[i-1];
    SmoothPeriod[i] = 0.33 * Period[i] + 0.67 * SmoothPeriod[i-1];
    DCPeriod[i] = int(SmoothPeriod[i]+0.5);
}
SetChartBkColor(colorWhite);
sp=DCperiod;

_SECTION_END();
slowper = 2/(sp+1);
EMAp =Param("EMA Period",14,5,60,1);
VARma = AMA(C,slowper);
OEMA  = EMA(C,EMAp);
MACDee = OEMA - Varma;
j = MACDee;
SetBarFillColor(IIf(MACDee>0,colorLime,colorRed));
PlotOHLC(0,j,0,j,EncodeColor(colorBlue)+"KMACD - V.1.0"+"("+WriteVal(EMAp,0)+","+WriteVal(dcperiod,0)+")",IIf(MACDee>0,colorLime,colorRed), styleCandle |styleOwnScale) ;Can someone plz backtest the below strategy for me, I am a big zero with Ami..
1. Instruments: bank nifty
2. Intrady startrgy with a mandatory close at 3:15pm
3.Buy if the below are met
a. 9:15 to 9:30 is the mother candel, and if the next 3 candel on 15min tf are inside bar, ie first 15 min high low is not broken for up to 10:15
b. Buy at the break of high of the day with a filter of 5 points
c. Sell at the break of low of day with a filter of 5 points
d. SL to be opposite end of the bar
Any doubts let me know...
Sent from my AO5510 using Tapatalk
Does anyone have supertrend afl used in zerodha? if so please share/ Thanks
Code:
_SECTION_BEGIN("Super Trend");
Factor=Param("Factor",4,1,10,0.1);
Pd=Param("ATR Periods",10,1,200,1);
Up=(H+L)/2+(Factor*ATR(Pd));
Dn=(H+L)/2-(Factor*ATR(Pd));
iATR=ATR(Pd);
TrendUp=TrendDown=Null;
trend[0]=1;
changeOfTrend=0;
flag=flagh=0;

for (i = 1; i <BarCount-1; i++) {

      TrendUp[i] = Null;TrendDown[i] = Null; trend[i]=1;
      if (Close[i]>Up[i-1]) {
         trend[i]=1;
         if (trend[i-1] == -1) changeOfTrend = 1;
		}

      else if (Close[i]<Dn[i-1]) {
         trend[i]=-1;
         if (trend[i-1] == 1) changeOfTrend = 1;
      }

      else if (trend[i-1]==1) {
         trend[i]=1;
         changeOfTrend = 0;
      }

      else if (trend[i-1]==-1) {
         trend[i]=-1;
         changeOfTrend = 0;
      }

      if (trend[i]<0 && trend[i-1]>0) {flag=1;}
      else {flag=0;}
      if (trend[i]>0 && trend[i-1]<0) {flagh=1;}
      else {flagh=0;}
      if (trend[i]>0 && Dn[i]<Dn[i-1]){Dn[i]=Dn[i-1];}
      if (trend[i]<0 && Up[i]>Up[i-1]){ Up[i]=Up[i-1];}
      if (flag==1){  Up[i]=(H[i]+L[i])/2+(Factor*iATR[i]);}
      if (flagh==1){ Dn[i]=(H[i]+L[i])/2-(Factor*iATR[i]);}
      if (trend[i]==1) {
			TrendUp[i]=Dn[i];
         	if (changeOfTrend == 1) {
            TrendUp[i-1] = TrendDown[i-1];
            changeOfTrend = 0;
         }
      }

      else if (trend[i]==-1) {
         TrendDown[i]=Up[i];
         if (changeOfTrend == 1) {
            TrendDown[i-1] = TrendUp[i-1];
            changeOfTrend = 0;
         }
      }
   }

Plot(TrendUp,"TrendUp",colorGreen);
Plot(TrendDown,"TrendDown",colorRed);

_SECTION_END();Dear Happy Singh
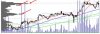
There is something i sincerely need your help. For volume at price chart, is there a way to display/determine the volume accumulated at each horizontal bar? if possible, can i code the horizontal volume bar for different color?let say bar turns to red if accumulated volume exceed number= 10000
_SECTION_BEGIN("Volume At Price");
PlotVAPOverlay( Param("Lines", 500, 100, 1000, 1 ), Param("Width", 12, 1, 100, 1 ), ParamColor("Color", colorGrey40 ), ParamToggle("Side", "Left|Right" ) | 4*ParamToggle("Z-order", "On top|Behind", 0 ) );
_SECTION_END();
Attached is the example of how it should be...
Thank you in advance, really need help from you , appreciate it, thank you
Attachments
-
 32.5 KB Views: 146
This is the one. You can change the ATR & Factor from Parameters as per your liking.
:thumb:
Code:
_SECTION_BEGIN("Super Trend");
Factor=Param("Factor",4,1,10,0.1);
Pd=Param("ATR Periods",10,1,200,1);
Up=(H+L)/2+(Factor*ATR(Pd));
Dn=(H+L)/2-(Factor*ATR(Pd));
iATR=ATR(Pd);
TrendUp=TrendDown=Null;
trend[0]=1;
changeOfTrend=0;
flag=flagh=0;

for (i = 1; i <BarCount-1; i++) {

      TrendUp[i] = Null;TrendDown[i] = Null; trend[i]=1;
      if (Close[i]>Up[i-1]) {
         trend[i]=1;
         if (trend[i-1] == -1) changeOfTrend = 1;
		}

      else if (Close[i]<Dn[i-1]) {
         trend[i]=-1;
         if (trend[i-1] == 1) changeOfTrend = 1;
      }

      else if (trend[i-1]==1) {
         trend[i]=1;
         changeOfTrend = 0;
      }

      else if (trend[i-1]==-1) {
         trend[i]=-1;
         changeOfTrend = 0;
      }

      if (trend[i]<0 && trend[i-1]>0) {flag=1;}
      else {flag=0;}
      if (trend[i]>0 && trend[i-1]<0) {flagh=1;}
      else {flagh=0;}
      if (trend[i]>0 && Dn[i]<Dn[i-1]){Dn[i]=Dn[i-1];}
      if (trend[i]<0 && Up[i]>Up[i-1]){ Up[i]=Up[i-1];}
      if (flag==1){  Up[i]=(H[i]+L[i])/2+(Factor*iATR[i]);}
      if (flagh==1){ Dn[i]=(H[i]+L[i])/2-(Factor*iATR[i]);}
      if (trend[i]==1) {
			TrendUp[i]=Dn[i];
         	if (changeOfTrend == 1) {
            TrendUp[i-1] = TrendDown[i-1];
            changeOfTrend = 0;
         }
      }

      else if (trend[i]==-1) {
         TrendDown[i]=Up[i];
         if (changeOfTrend == 1) {
            TrendDown[i-1] = TrendUp[i-1];
            changeOfTrend = 0;
         }
      }
   }

Plot(TrendUp,"TrendUp",colorGreen);
Plot(TrendDown,"TrendDown",colorRed);

_SECTION_END();I need to add more supertrend on to my chart like how we add MA indicators. we have only one afl for MA, but everytime we add, we can change the parameters and colors. Similar to that i want to make this supertrend afl. Could you please make this like that?
Thank you for the code. I really appreciate that.
I need to add more supertrend on to my chart like how we add MA indicators. we have only one afl for MA, but everytime we add, we can change the parameters and colors. Similar to that i want to make this supertrend afl. Could you please make this like that?
I need to add more supertrend on to my chart like how we add MA indicators. we have only one afl for MA, but everytime we add, we can change the parameters and colors. Similar to that i want to make this supertrend afl. Could you please make this like that?
Not exactly like you may add as many SuperTrend to a Single chart but I have this AFL where 2 SuperTrend will be drawn on different parameters. So you may be able to view 2 SuperTrend at the same time.
Code:
_SECTION_BEGIN("AlgoJi Best SuperTrend AFL");

SetChartOptions( 0, chartShowArrows | chartShowDates );
Plot( C, "Close", ParamColor( "Color", colorBlack ), styleNoTitle | ParamStyle( "Style" ) | GetPriceStyle() );


SetBarsRequired( 100000, 0 );

atr2 = Param( "ATR1 Factor", 3, 1, 5, 0.1 );
per2 = Param( "ATR1 Period", 10, 3, 100, 1 );
atr1 = Param( "ATR2 Factor", 5, 1, 20, 0.1 );
per1 = Param( "ATR2 Period", 10, 3, 100, 1 );


SetPositionSize( 1, spsShares );


UpBand1 = ( H + L ) / 2 + ( atr1 * ATR( per1 ) );
DnBand1 = ( H + L ) / 2 - ( atr1 * ATR( per1 ) );
indi1 = ATR( per1 );
RessArray = SuppArray = Null;
trend[0] = 1;
changeOfTrend = 0;
flag = flagh = 0;

UpBand2 = ( H + L ) / 2 + ( atr2 * ATR( per2 ) );
DnBand2 = ( H + L ) / 2 - ( atr2 * ATR( per2 ) );
indi2 = ATR( per2 );
RessArray2 = SuppArray2 = Null;
trend2[0] = 1;
changeOfTrend2 = 0;
flag2 = flagh2 = 0;


for ( i = 1; i < BarCount; i++ )
{

    trend[i] = 1;
    trend2[i] = 1;


    if ( Close[i] > UpBand1[i-1] )
    {
        trend[i] = 1;

        if ( trend[i-1] == -1 )
            changeOfTrend = 1;
    }
    else
        if ( Close[i] < DnBand1[i-1] )
        {
            trend[i] = -1;

            if ( trend[i-1] == 1 )
                changeOfTrend = 1;
        }
        else
            if ( trend[i-1] == 1 )
            {
                trend[i] = 1;
                changeOfTrend = 0;
            }
            else
                if ( trend[i-1] == -1 )
                {
                    trend[i] = -1;
                    changeOfTrend = 0;
                }

    if ( Close[i] > UpBand2[i-1] )
    {
        trend2[i] = 1;

        if ( trend2[i-1] == -1 )
            changeOfTrend2 = 1;
    }
    else
        if ( Close[i] < DnBand2[i-1] )
        {
            trend2[i] = -1;

            if ( trend2[i-1] == 1 )
                changeOfTrend2 = 1;
        }
        else
            if ( trend2[i-1] == 1 )
            {
                trend2[i] = 1;
                changeOfTrend2 = 0;
            }
            else
                if ( trend2[i-1] == -1 )
                {
                    trend2[i] = -1;
                    changeOfTrend2 = 0;
                }


    if ( trend[i] < 0 && trend[i-1] > 0 )
    {
        flag = 1;
    }
    else
    {
        flag = 0;
    }

    if ( trend[i] > 0 && trend[i-1] < 0 )
    {
        flagh = 1;
    }
    else
    {
        flagh = 0;
    }

    if ( trend[i] > 0 && DnBand1[i] < DnBand1[i-1] )
    {
        DnBand1[i] = DnBand1[i-1];
    }

    if ( trend[i] < 0 && UpBand1[i] > UpBand1[i-1] )
    {
        UpBand1[i] = UpBand1[i-1];
    }

    if ( flag == 1 )
    {
        UpBand1[i] = ( H[i] + L[i] ) / 2 + ( atr1 * indi1[i] );;
    }

    if ( flagh == 1 )
    {
        DnBand1[i] = ( H[i] + L[i] ) / 2 - ( atr1 * indi1[i] );;
    }


    if ( trend2[i] < 0 && trend2[i-1] > 0 )
    {
        flag2 = 1;
    }
    else
    {
        flag2 = 0;
    }

    if ( trend2[i] > 0 && trend2[i-1] < 0 )
    {
        flagh2 = 1;
    }
    else
    {
        flagh2 = 0;
    }

    if ( trend2[i] > 0 && DnBand2[i] < DnBand2[i-1] )
    {
        DnBand2[i] = DnBand2[i-1];
    }

    if ( trend2[i] < 0 && UpBand2[i] > UpBand2[i-1] )
    {
        UpBand2[i] = UpBand2[i-1];
    }

    if ( flag2 == 1 )
    {
        UpBand2[i] = ( H[i] + L[i] ) / 2 + ( atr2 * indi2[i] );
    }

    if ( flagh2 == 1 )
    {
        DnBand2[i] = ( H[i] + L[i] ) / 2 - ( atr2 * indi2[i] );
    }


    if ( trend[i] == 1 )
    {
        RessArray[i] = DnBand1[i];

        if ( changeOfTrend == 1 )
        {
            RessArray[i-1] = SuppArray[i-1];
            changeOfTrend = 0;
        }
    }
    else
        if ( trend[i] == -1 )
        {
            SuppArray[i] = UpBand1[i];

            if ( changeOfTrend == 1 )
            {
                SuppArray[i-1] = RessArray[i-1];
                changeOfTrend = 0;
            }
        }

    if ( trend2[i] == 1 )
    {
        RessArray2[i] = DnBand2[i];

        if ( changeOfTrend2 == 1 )
        {
            RessArray2[i-1] = SuppArray2[i-1];
            changeOfTrend2 = 0;
        }
    }
    else
        if ( trend2[i] == -1 )
        {
            SuppArray2[i] = UpBand2[i];

            if ( changeOfTrend2 == 1 )
            {
                SuppArray2[i-1] = RessArray2[i-1];
                changeOfTrend2 = 0;
            }
        }

}

prevH = TimeFrameGetPrice( "H", inDaily, -1 );

prevL = TimeFrameGetPrice( "L", inDaily, -1 );
Cond01 = 1;//H<PrevH;
Cond02 = 1;//L>PrevL;


Buy1 = Cross( O, Ref( RessArray, -1 ) ) AND Ref( RessArray, -1 ) > 0;
Sell1 = Cross( Ref( SuppArray, -1 ), O ) AND Ref( SuppArray, -1 ) > 0;
Buy = Buy1  AND Cond02;
Sell = ( Ref( SuppArray2, -1 ) > O AND Ref( SuppArray2, -1 ) > 0 );
Buy = ExRem( Buy, Sell );
Sell = ExRem( Sell, Buy );

Short = Sell1  AND Cond01;
Cover = ( O > Ref( RessArray2, -1 ) AND Ref( RessArray2, -1 ) > 0 ) ;
Short = ExRem( Short, Cover );
Cover = ExRem( Cover, Short );


Plot( RessArray, "First Support", colorGreen );
Plot( SuppArray, "First Resistance", colorRed );
Plot( RessArray2, "Second Support", colorGreen );
Plot( SuppArray2, "Second Resistance", colorRed );

Title = NumToStr( DateTime(), formatDateTime ) + " O " + O + " H " + H + " L " + L + " C " + C +
        "\nFirst Support: " + RessArray + " First Resistance: " + SuppArray + " Second Support: " + RessArray2 + " Second Resistance " + SuppArray2;


PlotShapes( IIf( Buy, shapeSquare, shapeNone ), colorGreen, 0, L, Offset = -40 );
PlotShapes( IIf( Buy, shapeSquare, shapeNone ), colorLime, 0, L, Offset = -50 );
PlotShapes( IIf( Buy, shapeUpArrow, shapeNone ), colorWhite, 0, L, Offset = -45 );
PlotShapes( IIf( Sell, shapeDownArrow, shapeNone ), colorRed, 0, H, Offset = -45 );
PlotShapes( IIf( Short, shapeSquare, shapeNone ), colorRed, 0, H, Offset = 40 );
PlotShapes( IIf( Short, shapeSquare, shapeNone ), colorOrange, 0, H, Offset = 50 );
PlotShapes( IIf( Short, shapeDownArrow, shapeNone ), colorWhite, 0, H, Offset = -45 );
PlotShapes( IIf( Cover, shapeUpArrow, shapeNone ), colorBlue, 0, L, Offset = -45 );

_SECTION_END();
:thumb:
Similar threads
-
Convert Simple Thinkscript Support/Resistance Lines into AFL
- Started by StockTempest
- Replies: 4
-
-
Coding help.........adding exploration for the simple combo
- Started by praveen5344
- Replies: 2
-
Help with simple coding...........SUPERTREND AND STOCHASTICS
- Started by praveen5344
- Replies: 3
-