Simple Coding Help - No Promise.

When I am using this code, and seeing the exploration, why "i" is always equal to 2464. Why its not starting from 1 and then increasing by 1 on every bar ?
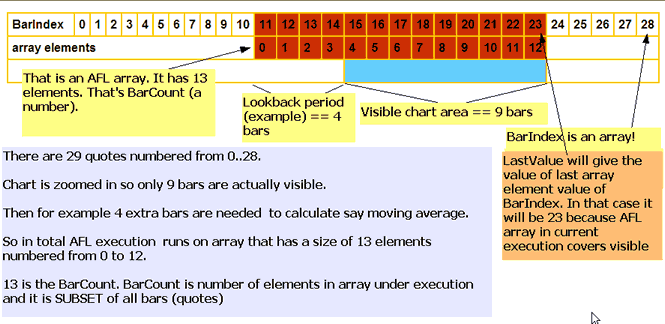
Because


Source: http://www.amibroker.com/kb/2008/07/03/quickafl/

Can you now please answer as "i" is being incremented in the "for" loop what will be the last value of "i" per execution? The same answer is the reason why "i" in your case is 2464 always. Hope it helps!
 

yusi

Well-Known Member
How to get the Williams %R value in exploration ?
Borrowing from Williams %R indicator that is inbuilt into Ami, you simply need to add a filter and column for exploration, and build on it to suit.

Code:
_SECTION_BEGIN("William's % R");
function PercentR( periods )
{
return -100 * ( HHV( H, periods ) - C )/( HHV( H, periods ) - LLV( L, periods ) );
}

//Plot( PercentR( Param("Periods", 14, 2, 100 ) ),
//        _DEFAULT_NAME(),
//        ParamColor("Color", ColorCycle ) );

Filter = 1; //modify to suit
AddColumn(PercentR(14), "WilliamsR");

_SECTION_END();
 
Yusi bro,

Have a little challenge to identify stocks in the oversold vis a vis overbought region :

_SECTION_BEGIN("William's % R");
function PercentR( periods )
{
return -100 * ( HHV( H, periods ) - C )/( HHV( H, periods ) - LLV( L, periods ) );
}

//Plot( PercentR( Param("Periods", 14, 2, 100 ) ),
// _DEFAULT_NAME(),
// ParamColor("Color", ColorCycle ) );

Filter = 1; //modify to suit
//AddColumn(PercentR(14), "WilliamsR");
AddColumn(PercentR(20), "WilliamsR",colorDefault,IIf(PercentR(20)>-80,colorRed,IIf(PercentR(20)>-20,colorLime,colorDefault)));

_SECTION_END();

Strangely it is coloring the stocks quite differently. Can you check this please.

Thanks in advance,

Cheers
JS
 

Attachments

Bro, also want to now how to adjust the columns in the exploration, as they seem to be too wide. I am using primitive version 5.60 and hence do not have the adjust columns option which I believe is available in the latest versions. Is there any code that can be added that will auto set the columns in accordance with the width of the tabular columns.

Thanks mate,

Cheers,
JS
 

yusi

Well-Known Member
AddColumn(PercentR(20), "WilliamsR",colorDefault,IIf(PercentR(20)>-80,colorRed,IIf(PercentR(20)>-20,colorLime,colorDefault)));
A value of -10 is greater than both -80 and -20. Rewrite your IIFs.

Not sure about adjusting column widths. Try Ctrl-+ for manual. Or perhaps, in your Analysis window under Settings, you may have a 'Auto-size columns to fit contents'.
 
Mate,

Changed the IIfs and now it is perfect. I can be a pest till my thoughts are transformed visually :), so please bear with me.

AddColumn(PercentR(20), "WilliamsR",colorDefault,IIf(PercentR(20)<-80,colorRed,IIf(PercentR(20)>-20,colorLime,colorDefault)));

While I get the result based on IIfs, how can I color the rest of the values in probably say grey, I mean values that doesnt meet the condition. I tried changing the color Default (in the end), but errors.

Cheers
JS
 

yusi

Well-Known Member
@JediStar Depending on whether you want the foreground or background color changed:

AddColumn(PercentR(20), "WilliamsR", 1.2, IIf(PercentR(20)<-80,colorRed,IIf(PercentR(20)>-20,colorLime,colorGrey50)));
AddColumn(PercentR(20), "WilliamsR", 1.2, colorDefault, IIf(PercentR(20)<-80,colorRed,IIf(PercentR(20)>-20,colorLime,colorGrey50)));
 
I put looping for stop loss purpose. Now how do I fix it in apply stop formula ?

cond1 = Open>(High+Low)/2;
cond2 = Close>(High + Low)/2;
cond3 = Ref(Open,-3)>Ref(Close,-3);


Buy = cond1 AND cond2 AND cond3 ;
sell= 0;

for (i=0 ; i<BarCount ; i++)

{

if(Buy) {
sl = Low ;

}
else {

sl = 0 ;

}
}

Filter = 1;
AddColumn(sl,"sl",1.22);
AddColumn(Low,"Low",1.22);
AddColumn(Buy, "Buy",1.22);
AddColumn(i, "i",1.22);

ApplyStop(stopTypeLoss,stopModePoint,sl,True);
ApplyStop(stopTypeProfit,stopModePercent,30);
 

Similar threads