


Simple Coding Help - No Promise.
- Thread starter Happy_Singh
- Start date
Dear friend Raj Jain,
I am fine, how have u been ?
Its good to hear from u again
In analysis window, in settings, change periodicity to daily/weekly/monthly and click on explore
I do not know whether it will work in amibroker 5.4 or not
This code will also show white arrows on chart when the required buy or sell condition is fulfilled ( just for visual confirmation )
here is the code
Code:
SetChartOptions(0,chartShowArrows|chartShowDates);
_N(Title = StrFormat("{{NAME}} - {{INTERVAL}} {{DATE}} Open %g, Hi %g, Lo %g, Close %g (%.1f%%) {{VALUES}}", O, H, L, C, SelectedValue( ROC( C, 1 ) ) ));
Plot( C, "Close", ParamColor("Color", colorDefault ), styleNoTitle | ParamStyle("Style") | GetPriceStyle() );
P = ParamField("Price field",-1);
Periods = Param("Periods", 15, 2, 300, 1 );
Width = Param("Width", 2, 0, 10, 0.05 );
d = ParamColor("BBbandcolor", colorYellow );
e = ParamColor("BBmidcolor", colorlightblue );
Color = ParamColor("Color", colorcycle );
Style = ParamStyle("Style");
mid = (BBandTop( P, Periods, Width ) + BBandbot( P, Periods, Width ))/2;
Plot( BBandTop( P, Periods, Width ), "BBTop" + _PARAM_VALUES(), d, Style );
Plot ( mid,"",e,styleLine);
Plot( BBandBot( P, Periods, Width ), "BBBot" + _PARAM_VALUES(), d, Style );
t=BBandTop( P, Periods, Width );
s=BBandBot( P, Periods, Width );
Realbody =abs(O-C);
Lowershadow = abs(Min(O,C) - L);
Uppershadow =abs( H - Max(O,C));
ll = ((abs(Min(O,C) - L))/realbody)*100;
hh = ((abs( H - Max(O,C)))/realbody)*100;
condl = L==ValueWhen(ll<50,L);
condh = H==ValueWhen(hh<50,H);
cond = condl AND condh;
condbuy = Cross(C,mid) AND H<t AND L>s AND C>O AND cond;
PlotShapes(IIf(condbuy,shapeUpArrow,shapeNone),colorWhite,0,L,-12);
condsell = Cross(mid,C) AND H<t AND L>s AND C<O AND cond;
PlotShapes(IIf(condsell,shapeDownArrow,shapeNone),colorWhite,0,H,-12);
Filter = condbuy OR condsell;
AddColumn(IIf(condbuy,C,Null),"Buy",1.2,colorDefault,IIf(condbuy,colorGreen,Null));
AddColumn(IIf(condsell,C,Null),"Sell",1.2,colorDefault,IIf(condsell,colorRed,Null));
Last edited:
_SECTION_BEGIN("CRB obv");
x=Param("Min of CR:",30,0,375,1);
nd=Day() != Ref(Day(), -1);
crbh = ValueWhen(nd,Ref(HHV(OBV(),x),-1));
crbl = ValueWhen(nd,Ref(LLV(OBV(),x),-1));
Plot(crbh,"\nCRB H",colorBlack);
Plot(crbL,"\nCRB L",colorBlack);
if( ParamToggle("CRB cloud", "No|Yes", 1))
PlotOHLC(crbl,crbh,crbl,crbl,"",ParamColor("R col",colordarkgrey),stylenoreScale|styleNoLabel|styleCloud,0,0,0,-7);
_SECTION_END();
this is crb obv can we please have change in code for showing next days crb lines drawn with the click of a button ??
show it at eod itself at levels it will show next day
Hi Seniors,
Could you please help me identify where am I going wrong in the code given below. I have identified the two codes in Line 242 and 243 where I am not getting the number of bars past the defined high and defined low based on BarsSince syntax, but what I get is "Zero" value as you will see in the title if you use the entire code to chart. Please note that I am not the author of the code and all credit goes to the originator of this code, I have just added the line arrays to see which high's or low's are broken and am trying to find the number of bars it has taken them to do so, or number or bars taken for the failure. At the moment I want to know how many bars have past the defined high or low.
Many thanks for your kind help in advance.
Code:
_SECTION_BEGIN("Price");
SetChartOptions(0,chartShowArrows|chartShowDates);
_N(Title = StrFormat("{{NAME}} - {{INTERVAL}} {{DATE}} Open %g, Hi %g, Lo %g, Close %g (%.1f%%) {{VALUES}}", O, H, L, C, SelectedValue( ROC( C, 1 ) ) ));
Plot( C, "Close", ParamColor("Color", colorDefault ), styleNoTitle | ParamStyle("Style") | GetPriceStyle() );
_SECTION_END();

_SECTION_BEGIN ("HH LL - Markers");

//All credit goes to the author of this code, I am not the author of this code.
RequestTimedRefresh(0.1,True);
xx=BarIndex();x=xx;Lx=LastValue(x);
rightStrength=Param("Fractal Pivot Right side Strength",5,2,50,1);
leftStrength=Param("Fractal Pivot Left side Strength",10,2,50,1);
tf=Param("Time Frame (min)",5,1,1440,1);
tfrm=in1Minute*tf;
CleanPivots=ParamToggle("Force Pivots to Alternate","Off|On",0);
Cttop=Param("Code Title Top",15,1,250,1);
Ctspac=Param("Code Title Spacing",15,1,250,1);
dispLabels=ParamToggle("Display Labels","Off|On",1);
LabelColor=ParamColor("Label Color",colorYellow);
GfxSetTextColor(ParamColor("Code Title Color",colorLightGrey));
backGroundColor=ParamColor("Chart Background Color",colorBlack);

TimeFrameSet(tfrm);
pk=H>Ref(HHV(H,leftStrength),-1) AND Ref(HHV(H,rightStrength),rightStrength)<=H;
tr=L<Ref(LLV(L,leftStrength),-1) AND Ref(LLV(L,rightStrength),rightStrength)>=L;

px0=ValueWhen(pk,x,0); tx0=ValueWhen(tr,x,0);
px1=ValueWhen(pk,x,1); tx1=ValueWhen(tr,x,1);
px2=ValueWhen(pk,x,2); tx2=ValueWhen(tr,x,2);
ph0=ValueWhen(pk,H,0); tl0=ValueWhen(tr,L,0);
ph1=ValueWhen(pk,H,1); tl1=ValueWhen(tr,L,1);
ph2=ValueWhen(pk,H,2); tl2=ValueWhen(tr,L,2);
ph3=ValueWhen(pk,H,3); tl3=ValueWhen(tr,L,3);
ph4=ValueWhen(pk,H,4); tl4=ValueWhen(tr,L,4);

if(CleanPivots)
{
    pk=IIf((ph0>=ph1 AND tx0>px0 AND px0!=px1)
    OR (ph1<ph2 AND px2>tx1)
    OR (ph0>=ph1 AND tx0<px0 AND tx0==tx1 AND px0!=px1)
    ,False,pk);
    tr=IIf((tl0<=tl1 AND px0>tx0 AND tx0!=tx1)
    OR (tl1>tl2 AND tx2>px1)
    OR (tl0<=tl1 AND px0<tx0 AND px0==px1 AND tx0!=tx1)
    ,False,tr);

    px0=ValueWhen(pk,x,0); tx0=ValueWhen(tr,x,0);
    px1=ValueWhen(pk,x,1); tx1=ValueWhen(tr,x,1);
    px2=ValueWhen(pk,x,2); tx2=ValueWhen(tr,x,2);
    ph0=ValueWhen(pk,H,0); tl0=ValueWhen(tr,L,0);
    ph1=ValueWhen(pk,H,1); tl1=ValueWhen(tr,L,1);
    ph2=ValueWhen(pk,H,2); tl2=ValueWhen(tr,L,2);
    ph3=ValueWhen(pk,H,3); tl3=ValueWhen(tr,L,3);
    ph4=ValueWhen(pk,H,4); tl4=ValueWhen(tr,L,4);
}

pkh=IIf(pk,H,Null);trl=IIf(tr,L,Null);
TimeFrameRestore();
fact=Nz(Max(tfrm/60,Interval()/60)/(Interval()/60));
if(fact==0)fact=1;
Lkbk=Nz(tfrm/Interval());
if(Lkbk>1)
{
    pk=TimeFrameExpand(pk,tfrm,expandFirst);
    pkh=TimeFrameExpand(pkh,tfrm,expandFirst);
    pkhs=IIf(!IsEmpty(pkh),1,0);pkhs=pkhs-Ref(pkhs,-1);
    pk=pk AND H==pkh;
    cond1=Sum(pk,BarsSince(pkhs==1)+1)==1 AND pk;
    pk=pk AND cond1;

    tr=TimeFrameExpand(tr,tfrm,expandFirst);
    trl=TimeFrameExpand(trl,tfrm,expandFirst);
    trls=IIf(!IsEmpty(trl),1,0);trls=trls-Ref(trls,-1);
    tr=tr AND L==trl;
    cond1=Sum(tr,BarsSince(trls==1)+1)==1 AND tr;
    tr=tr AND cond1;
}
px0=ValueWhen(pk,x,0); tx0=ValueWhen(tr,x,0);
px1=ValueWhen(pk,x,1); tx1=ValueWhen(tr,x,1);
px2=ValueWhen(pk,x,2); tx2=ValueWhen(tr,x,2);
ph0=ValueWhen(pk,H,0); tl0=ValueWhen(tr,L,0);
ph1=ValueWhen(pk,H,1); tl1=ValueWhen(tr,L,1);
ph2=ValueWhen(pk,H,2); tl2=ValueWhen(tr,L,2);


ll=tr AND tl1<tl2;
hl=tr AND tl1>tl2;
hh=pk AND ph1>ph2;
lh=pk AND ph1<ph2;
dt=pk AND ph1==ph2;
db=tr AND tl1==tl2;

//GraphXSpace=5;SetChartBkColor(backGroundColor);
//SetChartOptions(0,chartShowDates);
//SetBarFillColor(IIf(C>O,colorGreen,IIf(C<=O,colorRed,colorLightGrey)));
//Plot(C,"Price",IIf(C>O,colorDarkGreen,IIf(C<=O,colorDarkRed,colorLightGrey)),64,0,0,0,0);
Plot(pkh,"",colorRed,styleThick,0,0,0,-1);
Plot(trl,"",colorBrightGreen,styleThick,0,0,0,-1);
PlotShapes(shapeSmallCircle*tr,IIf(Lx-ValueWhen(tr,x)>=rightStrength*fact,ColorRGB(0,100,0),colorWhite),0,L,-10);
PlotShapes(shapeSmallCircle*pk,IIf(Lx-ValueWhen(pk,x)>=rightStrength*fact,ColorRGB(255,0,0),colorWhite),0,H,10);

qq=Interval()/60;
if(qq < 60){tf=" min";tt=qq;}
else if(qq >= 60 AND qq < 1440){tf=" hrs";tt=qq/60;}
else if(qq >= 1440){tf=" days";tt=(qq/60)/24;}
qq=Max(tfrm/60,Interval()/60);
if(qq < 60){tfa=" min";tta=qq;}
else if(qq >= 60 AND qq < 1440){tfa=" hrs";tta=qq/60;}
else if(qq >= 1440){tfa=" days";tta=(qq/60)/24;}

//GfxSetOverlayMode(0);
//GfxSetBkMode(1);
//GfxSelectFont("Tahoma",11,200);
//GfxTextOut("Right Strenght: "+rightStrength,5,Cttop);
//GfxTextOut("Left Strenght: "+leftStrength,5,Cttop+Ctspac);
//GfxTextOut("Chart Timeframe: "+tt+""+tf,5,Cttop+Ctspac*2);
//GfxTextOut("Pivot Timeframe: "+tta+""+tfa,5,Cttop+Ctspac*3);

abcdy_up=27;
abcdy_dn=15;
function GetVisibleBarCount()
{
    lvb=Status("lastvisiblebar");
    fvb=Status("firstvisiblebar");
    return Min(lvb-fvb,BarCount-fvb);
}
function GfxConvertPixelToValueY(Pixels)
{
    local Miny,Maxy,pxchartbottom,pxchartheight;
    Miny=Status("axisminy");
    Maxy=Status("axismaxy");
    pxchartbottom=Status("pxchartbottom");
    pxchartheight=Status("pxchartheight");
    fac=pxchartheight/Pixels;
    Value=(Maxy-Miny)/fac;
    return Nz(Value);
}
function GfxConvertBarToPixelX(bar)
{
    lvb=Status("lastvisiblebar");
    fvb=Status("firstvisiblebar");
    pxchartleft=Status("pxchartleft");
    pxchartwidth=Status("pxchartwidth");
    return Nz(pxchartleft+bar*pxchartwidth/(lvb-fvb+1));
}
function GfxConvertValueToPixelY(value)
{
    local Miny,Maxy,pxchartbottom,pxchartheight;
    Miny=Status("axisminy");
    Maxy=Status("axismaxy");
    pxchartbottom=Status("pxchartbottom");
    pxchartheight=Status("pxchartheight");
    return Nz(pxchartbottom-floor(0.5+(Value-Miny)*pxchartheight/(Maxy-Miny)));
}
AllVisibleBars=GetVisibleBarCount();
fvb=Status("firstvisiblebar");
abcdy_up=GfxConvertPixelToValueY(abcdy_up);
abcdy_dn=GfxConvertPixelToValueY(abcdy_dn);

for(i=0;i<AllVisibleBars;i++)
{
    GfxSelectFont("Tahoma",8,500);GfxSetBkMode(1);
    if(ll[i+fvb] AND dispLabels)
    {
        lvix=i+fvb;
        GfxSetTextColor(LabelColor);GfxTextOut("LL",
        GfxConvertBarToPixelX(i)-3,GfxConvertValueToPixelY(L[lvix]-abcdy_dn));
    }
    if(hl[i+fvb] AND dispLabels)
    {
        lvix=i+fvb;
        GfxSetTextColor(LabelColor);GfxTextOut("HL",
        GfxConvertBarToPixelX(i)-3,GfxConvertValueToPixelY(L[lvix]-abcdy_dn));
    }
    if(db[i+fvb] AND dispLabels)
    {
        lvix=i+fvb;
        GfxSetTextColor(LabelColor);GfxTextOut("DB",
        GfxConvertBarToPixelX(i)-3,GfxConvertValueToPixelY(L[lvix]-abcdy_dn));
    }
    if(hh[i+fvb] AND dispLabels)
    {
        lvix=i+fvb;
        GfxSetTextColor(LabelColor);GfxTextOut("HH",
        GfxConvertBarToPixelX(i)-5,GfxConvertValueToPixelY(H[lvix]+abcdy_up));
    }
    if(lh[i+fvb] AND dispLabels)
    {
        lvix=i+fvb;
        GfxSetTextColor(LabelColor);GfxTextOut("LH",
        GfxConvertBarToPixelX(i)-5,GfxConvertValueToPixelY(H[lvix]+abcdy_up));
    }
    if(dt[i+fvb] AND dispLabels)
    {
        lvix=i+fvb;
        GfxSetTextColor(LabelColor);GfxTextOut("DT",
        GfxConvertBarToPixelX(i)-5,GfxConvertValueToPixelY(H[lvix]+abcdy_up));
    }
}

_SECTION_END();

_SECTION_BEGIN("Fix High Low Marker");

selecthigh = ParamList("Select High Point","ph1|ph2|ph3|ph4",1);
selectlow = ParamList("Select Low Point", "tl1|tl2|tl3|tl4",1);

PDH_ = Null;
PDL_ = Null;
Offset = 5;

if(selecthigh=="ph1")
{PDH_        = ph1;
PDHLine = LineArray(offset,SelectedValue(ph1),BarCount+2,SelectedValue(ph1),1);
}
if(selecthigh=="ph2")
{PDH_         = ph2;
PDHLine = LineArray(offset,SelectedValue(ph2),BarCount+2,SelectedValue(ph2),1);}
if(selecthigh=="ph3")
{PDH_         = ph3;
PDHLine = LineArray(offset,SelectedValue(ph3),BarCount+2,SelectedValue(ph3),1);}
if(selecthigh=="ph4")
{PDH_         = ph4;
PDHLine = LineArray(offset,SelectedValue(ph4),BarCount+2,SelectedValue(ph4),1);}

if(selectlow=="tl1")
{PDL_        = tl1;
PDLLine = LineArray(offset,SelectedValue(tl1),BarCount+2,SelectedValue(tl1),1);}
if(selectlow=="tl2")
{PDL_        = tl2;
PDLLine = LineArray(offset,SelectedValue(tl2),BarCount+2,SelectedValue(tl2),1);}
if(selectlow=="tl3")
{PDL_        = tl3;
PDLLine = LineArray(offset,SelectedValue(tl3),BarCount+2,SelectedValue(tl3),1);}
if(selectlow=="tl4")
{PDL_        = tl4;
PDLLine = LineArray(offset,SelectedValue(tl4),BarCount+2,SelectedValue(tl4),1);}

Plot(PDHLine,"LP",colorGreen,styleDashed|styleThick|stylenorescale);
Plot(PDLLine,"LT",colorRed,styleDashed|styleThick|stylenorescale);

//Following two lines below does not give the desired result but just "Zero" value.
BarsSinceHigh = BarsSince(PDH_); // I think I am wrong somewhere here
BarsSinceLow = BarsSince(PDL_);// and this line as well is wrong somewhere

Title = EncodeColor(colorYellow)+"Bars Since Defined High"+BarsSinceHigh+"\n"+
    "Bars Since Defined Low"+BarsSinceLow;

_SECTION_END();Hi @Romeo1998
I need your help to code one logic as asked by one member in another thread.
Please help
Buy Entry :
----------
Scan stocks which are OPEN=LOW
EMA 5 > EMA 20 in 5min,15min,30 min
SuperTrend (21-4) is up in 5min,15min,30 min
If all satisfied at 9.46 am, take a buy
Stoploss :
----------
9.15-9.45 lowest low
Target Or Exit :
----------------
Exit at 3.15 pm
Sell entry :
------------
Scan stocks which are OPEN=HIGH
EMA 5 < EMA 20 in 5min,15min,30 min
SuperTrend (21-4) is down in 5min,15min,30 min
If all satisfied at 9.46 am, take a sell
Stoploss :
----------
9.15-9.45 highest high
Target Or Exit :
----------------
Exit at 3.15 pm
Hello ...
May i also request for an AFL & Scanner which can find scripts trading above 200 SMA in 15mint & daily time frame ???
May i also request for an AFL & Scanner which can find scripts trading above 200 SMA in 15mint & daily time frame ???
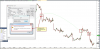
In analysis window, select this code in Formula n click on explore to scan for the required condition
this code will also plot the 200 sma of 15 mins n daily timeframe, and yellow dots above price when its above the 200 sma of 15 mins n daily timeframe ( just for visual confirmation
)here is the code
Code:
p=Param("Periods",200,2,1000,1);
TimeFrameSet(in15Minute);
C15 = MA(C,p);
TimeFrameRestore();
MA_C15 = TimeFrameExpand(C15,in15Minute,expandLast);
Plot(MA_C15,"15min Sma",colorLime,styleLine);
TimeFrameSet(inDaily);
Cdaily = MA(C,p);
TimeFrameRestore();
MA_daily = TimeFrameExpand(Cdaily,inDaily,expandLast);
Plot(MA_daily,"Daily Sma",colorLightBlue,styleLine);
cond = C>MA_C15 AND C>MA_daily;
PlotShapes(cond*shapesmallCircle,colorYellow,0,H,15);
Filter = cond;
AddColumn(IIf(cond,1,Null),"Condition",1,-1,IIf(cond,colorLightYellow,Null));
AddColumn(IIf(cond,MA_C15,Null),"MA in 15 mins",1.2,-1,IIf(cond,colorLightOrange,Null));
AddColumn(IIf(cond,MA_daily,Null),"MA in daily",1.2,-1,IIf(cond,colorLavender,Null));
AddColumn(IIf(cond,C,Null),"Close",1.2,-1,IIf(cond,colorlightBlue,Null));
Dear friend cellclinic,
In analysis window, select this code in Formula n click on explore to scan for the required condition
this code will also plot the 200 sma of 15 mins n daily timeframe, and yellow dots above price when its above the 200 sma of 15 mins n daily timeframe ( just for visual confirmation )
here is the code
In analysis window, select this code in Formula n click on explore to scan for the required condition
this code will also plot the 200 sma of 15 mins n daily timeframe, and yellow dots above price when its above the 200 sma of 15 mins n daily timeframe ( just for visual confirmation
)here is the code
Code:
p=Param("Periods",200,2,1000,1);
TimeFrameSet(in15Minute);
C15 = MA(C,p);
TimeFrameRestore();
MA_C15 = TimeFrameExpand(C15,in15Minute,expandLast);
Plot(MA_C15,"15min Sma",colorLime,styleLine);
TimeFrameSet(inDaily);
Cdaily = MA(C,p);
TimeFrameRestore();
MA_daily = TimeFrameExpand(Cdaily,inDaily,expandLast);
Plot(MA_daily,"Daily Sma",colorLightBlue,styleLine);
cond = C>MA_C15 AND C>MA_daily;
PlotShapes(cond*shapesmallCircle,colorYellow,0,H,15);
Filter = cond;
AddColumn(IIf(cond,1,Null),"Condition",1,-1,IIf(cond,colorLightYellow,Null));
AddColumn(IIf(cond,MA_C15,Null),"MA in 15 mins",1.2,-1,IIf(cond,colorLightOrange,Null));
AddColumn(IIf(cond,MA_daily,Null),"MA in daily",1.2,-1,IIf(cond,colorLavender,Null));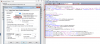
AddColumn(IIf(cond,C,Null),"Close",1.2,-1,IIf(cond,colorlightBlue,Null));But getting an error please check it dear & guide
Attachments
-
 113.8 KB Views: 27
 -
 100.1 KB Views: 26
Similar threads
-
Convert Simple Thinkscript Support/Resistance Lines into AFL
- Started by StockTempest
- Replies: 4
-
-
Coding help.........adding exploration for the simple combo
- Started by praveen5344
- Replies: 2
-
Help with simple coding...........SUPERTREND AND STOCHASTICS
- Started by praveen5344
- Replies: 3
-