ANALYSING 5 MIN & 60 MIN FUT CHARTS FOR INTRADAY TRADING
Biyas Da has actually told my story, and also concluded with the importance of chart-reading as first step of chart analysing...
One should overcome the fear of chart-reading, and learn how to make them your true GUIDE while in trade.
First, let us understand how to READ intraday charts. I use 5 min charts to mark out all levels as SUPPORTS & RESISTANCES which can come handy during intraday scalping trading, and then refer to 60 min charts to sort out the KEY ones among them, which can come handy in intraday swing trades.
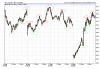
Let's first see a 5 min chart of last 5 days.. (actually, sometimes for the next trading session, even last 3 day chart may be enough)
In the chart attached, one can see RED & GREEN BARS. Begin from the last trading session and keep moving left when the day's range of levels get exhausted...
The LOW OF GREEN BARS (WITH GOOD BAR HEIGHT OR WITH LONG TAILS) INDICATE GOOD SUPPORT LEVELS, FROM WHERE BUYING/SHORT-COVERING HAD EMERGED DURING TRADE.
SIMILIARLY, THE HIGH OF RED BARS (ESPECIALLY ONES WHICH APPEAR LIKE THE TOP OF TRIANGLE) INDICATE GOOD RESISTANCE LEVELS, FROM WHERE SELLING/PROFIT-BOOKING HAD TAKEN PLACE DURING TRADE.
AND AREAS/ZONES, WHERE THERE SEEMS TO BE LOT OF CONSOLIDATION & ZIG-ZAG MOVEMENTS, INDICATE GOOD RSR LEVELS (PROVIDING BOTH RESISTANCE & SUPPORT - MOSTLY THESE ARE LEVELS IN MULTIPLES OF 50, EG 4000, 4050...) THESE REALLY COME HANDY FOR SCALPING TRADES, EITHER FOR INITIATING OR AS STOPS
The good support levels for 19/9/08 from the above chart are:
4022 / 4007 / 3994 / 3967 / 3888
Resistances: 4072 / 4082 / 4098
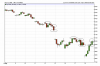
AND NOW MOVING TO 60 MIN CHART - this indeed cuts out the "noise" factor and gives a sense of direction of the flow.
Here too, the same logic applies for finding supports & resistances - but, if one spots a cluster of bars ending or starting from same level, then that level also becomes support or resistance, as the case maybe, irrespective of the colour of the bar. For example, the last 3 bars of 17/9/08 had lows of around 3990... this indicates RSR level, and can provide resistance if coming from down, or provide support if coming from up... and as expected, in the next trading session of 18/9/08, it turned out to be the high of 12:00 bar (infact, NF fell from 3996 to 3960 between 12:40 and 12:50)... as said earlier about the importance of RSR levels...!!!
From the 60 min charts-
SUPPORTS: 3994 / 3982 / 3888 / 3586
RESISTANCES: 4072 / 4098 / 4216 / 4279 / 4305 / 4319
Actually, there are other levels too between 4100 & 4200... I had to increase the time period of the chart to 3 months (not posted here, because then the levels would not appear clear due to size issue)
4138 - 4150 - 4163
Now, just marry the two sets (5 min & 60 min) and you have your "magical" levels ready...
One should make full advantage of times when Round figure levels appear in SPOT or in FUT (whichever comes first).... they remain the KING OF RSR levels for scalping of more than 15 points, and come handy for both longs & shorts...
Do this exercise every evening... note down these levels & try to do actual trading using them - start with small qty / use mini - this will enhance your confidence...
ALSO, DURING TRADING HOURS, APPLY THE SAME METHOD TO GET FRESH SUPPORTS & RESISTANCE FROM THE ACTIVE TRADING SESSION'S INTRADAY CHART....


")