


Set-Ups disscused & practised @ Nifty Futures Trading Thread.
- Thread starter uasish
- Start date
- Tags nifty intraday trading scalp
Combine the POWER OF TRADING-FLOOR PIVOT LEVELS, along with the above levels...
THESE PIVOT LEVELS GIVE A SENSE OF TRADING DIRECTION
One can calculate these levels using the universal formula for such pivotal levels by providing the previous trading session's High, Low & Close values of your particular scrip/index spot/fut
one online pivot calculator is available at:
www.traderknowledge.com/free-online-pivot-point-calculator.php
over here, just enter 0 (zero) for Open values.. (u will get same results even if u enter any value or correct value for Open....but all other values - LOW, HIGH, CLOSE should be perfect, as seen in your broker-provided trading terminal/software.
also, there are many websites which give these levels readily calculated...
www.prafulstockpiks.com/reports1.htm
www.stratstar.com/BSE-India-NSE-SupportResistanceLevels.htm
and many others...
the logic of pivots is that once the pivotal (central) level is sustained, then R1 / R2 can be targetted/provide resistance.
similiarly, if the scrip/index sustains below the pivotal level, then S1, S2 can be attained/provide support...
similiarly, if scrip/index opens at R1 level & profit-booking is seen, then support can be found at pivot...
in short the movement of the scrip/index is in this direction:
S3 -> S2 -> S1 -> PIVOT -> R1 -> R2 -> R3
in ranged-trading days, we may even see "table-tennis" between any 2 consecutive levels, like Pivot & R1, or R1 & R2, S1 & Pivot, etc

sunil very nice
sometimes it happens we can trade os well on our logic but sometiems it becomes to summarise step / step...
easy to speak/ difficult to write
u ahve potrayed the simplest way of buy / sel points especially to novice ones
truly when i read,,,as a starter i felt.. nothing more to do / see,,,
no candles/ tendlines/ fib/...etc.waves
good extremely good!!
renu
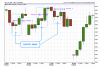
INSIDE-BAR IN 60 MINS - BREAKOUT TRADING

recent examples of inside bars in 60 min charts...
Date - Hour Bar
11/9 - 13:00
12/9 - 11:00
15/9 - 12:00
16/9 - 13:00
17/9 - 11:00
all these bars were "inside bars" ie their High and Low (let's call them H1 and L1) were within the High & Low of the preceding bar(let's call them H2 & L2)...
Ideally & theoretically, when an inside bar breaks, for eg, on the upside, then above H1, H2 is generally the first target.. similiarly, if breaks down below L1, then L2 should come up...
Inside-bars works well on bigger Time Frames (TF).. they are actually meant for EOD (end of day) charts... i thought of bringing them into our intraday trading by using the 60 min chart as perspective..
(there's also the possibility of bringing down the TF to 30 min... but below that TF is really not advisable, as there are chances of whipsaws & lesser H2s or L2s...)
PLEASE NOTE THE DECISION TO TRADE ON SUCH BREAKOUT DEPENDS ON FOREMOST ON THE DIFFERENCE BETWEEN H1 & H2 (in case of break on upside), and ON THE DIFFERENCE BETWEEN L1 & L2 (in case of break on downside)...
not a norm, but less than 10 points difference is not worth it... but please note, IT DOES NOT MEAN THAT BREAKOUT WILL HALT AT H2/L2...
IT CAN ALSO GO BEYOND THOSE LEVELS (depends on the market condition & RSR status of H2/L2)
inside bars ideally target H2 / L2 (as the case maybe).. beyond that, one has to look at left side of last 1/3/5 intraday charts for further targets ie supports & resistance...
An inside bar is a bar which is completely within the range of the preceding bar, i.e. it has a higher low and lower high than the bar immediately before it. An inside bar indicates a time of indecision or consolidation. On a smaller time frame it will look like a triangle. Inside bars often occur at tops and bottoms, in continuation flags, and at key decision points like major support/resistance levels and consolidation breakouts. They often provide a low-risk place to enter a trade or a logical exit point.
renu
renu
recent examples of inside bars in 60 min charts...
Date - Hour Bar
11/9 - 13:00
12/9 - 11:00
15/9 - 12:00
16/9 - 13:00
17/9 - 11:00
all these bars were "inside bars" ie their High and Low (let's call them H1 and L1) were within the High & Low of the preceding bar(let's call them H2 & L2)...
Ideally & theoretically, when an inside bar breaks, for eg, on the upside, then above H1, H2 is generally the first target.. similiarly, if breaks down below L1, then L2 should come up...
Inside-bars works well on bigger Time Frames (TF).. they are actually meant for EOD (end of day) charts... i thought of bringing them into our intraday trading by using the 60 min chart as perspective..
(there's also the possibility of bringing down the TF to 30 min... but below that TF is really not advisable, as there are chances of whipsaws & lesser H2s or L2s...)
PLEASE NOTE THE DECISION TO TRADE ON SUCH BREAKOUT DEPENDS ON FOREMOST ON THE DIFFERENCE BETWEEN H1 & H2 (in case of break on upside), and ON THE DIFFERENCE BETWEEN L1 & L2 (in case of break on downside)...
not a norm, but less than 10 points difference is not worth it... but please note, IT DOES NOT MEAN THAT BREAKOUT WILL HALT AT H2/L2...
IT CAN ALSO GO BEYOND THOSE LEVELS (depends on the market condition & RSR status of H2/L2)
inside bars ideally target H2 / L2 (as the case maybe).. beyond that, one has to look at left side of last 1/3/5 intraday charts for further targets ie supports & resistance...
Attachments
-
 34 KB Views: 581
Last edited:
INSIDE-BAR IN 60 MINS - BREAKOUT TRADING
recent examples of inside bars in 60 min charts...
Date - Hour Bar
11/9 - 13:00
12/9 - 11:00
15/9 - 12:00
16/9 - 13:00
17/9 - 11:00
all these bars were "inside bars" ie their High and Low (let's call them H1 and L1) were within the High & Low of the preceding bar(let's call them H2 & L2)...
Ideally & theoretically, when an inside bar breaks, for eg, on the upside, then above H1, H2 is generally the first target.. similiarly, if breaks down below L1, then L2 should come up...
Inside-bars works well on bigger Time Frames (TF).. they are actually meant for EOD (end of day) charts... i thought of bringing them into our intraday trading by using the 60 min chart as perspective..
(there's also the possibility of bringing down the TF to 30 min... but below that TF is really not advisable, as there are chances of whipsaws & lesser H2s or L2s...)
PLEASE NOTE THE DECISION TO TRADE ON SUCH BREAKOUT DEPENDS ON FOREMOST ON THE DIFFERENCE BETWEEN H1 & H2 (in case of break on upside), and ON THE DIFFERENCE BETWEEN L1 & L2 (in case of break on downside)...
not a norm, but less than 10 points difference is not worth it... but please note, IT DOES NOT MEAN THAT BREAKOUT WILL HALT AT H2/L2...
IT CAN ALSO GO BEYOND THOSE LEVELS (depends on the market condition & RSR status of H2/L2)
inside bars ideally target H2 / L2 (as the case maybe).. beyond that, one has to look at left side of last 1/3/5 intraday charts for further targets ie supports & resistance...
Sunil, please clarify about the chart posted!!! It does not match the chart I have for the corresponding period!!
Would like to have your comment on use of Inside bar for smaller time frame :
Say in 5 minutes chart we have 3 consecutive inside bars, i.e. one bar followed by 3 bars within the same range of this first bar, would such a set up ideal for trading as suggested in 60 min. perspective!!! Would be more of a scalping!!!
Regards
R K Karnani
TECHNICAL INDICATORS - SLOW STOCHS + RSI
Ok, so now you have your support & resistance levels, pivotal levels, etc... but still one may be hesitant to initiate a trade. Wish someone was there to TELL us when to go ahead and and enter long/short...
Well, I personally use two indicators RSI & SLOW STOCHS for my intraday trades...
I won't get into definitions & technical stuff of the above. To the point, how to use it...
RSI:
In your market-watch window, right-click on NIFTY FUT - 1M (ie the current series' nifty future), select "Intraday Chart"...
A tick-by-tick live intraday chart of NF will pop up in new window. There will be an option to change the timeframe (TF) of the chart... Select 1 minute. Also, change the chart type from line to candlestick (this change of type is not necessary)... So, instead of tick-by-tick chart, you'll have the 1 minute chart in front of you (of the current session)... Now, select Relative Stength Index (RSI) from "Indicators" menu and in the parameters pop-up window, select 14.
RSI gives the over-bought & over-sold status of nifty future in form of numbers...
at or below 30 level is supposed to be over-sold... an upmove is due
at or above 70 level is supposed to be over-bought.. a down move can be expected...
SLOW STOCHS:
i prefer slow stoch over 5 day charts parameter. there's this website which has the intraday chart of NIFTY SPOT + slow stoch + RSI...
http://niftyintraday.googlepages.com/nifty50
it updates itself automatically every minute.
It's the crossover of slow stochs at a partular level which indicates buy or sell...
crossover at or above 80 is signal for sell
crossover at or below 20 is signal for buy
One should start booking profit partly when it reaches or crosses 50..
Now, as in case of other indicators, there are some days when only one side of the signal has to be followed.
Like, in these bearish days, it's always better to short when RSI / Slow stoch gives the necessary signal... and to avoid the buy signals... ie SHORT ON RALLIES, INSTEAD OF BOTTOM FISHING....
read this for more info:
http://www.tradingacademy.com/lessons/lessons20080208.shtm
THESE INDICATORS WILL FAIL ON BIG TREND-REVERSAL DAYS... eg, they will indicate over-bought for more than 30 minutes, but still one may not find significant downmove. Such days happen once in a while, and market mood itself will indicate whether the main focus should be to buy on dips or sell on rallies....
(here's the recent 5 day chart of nifty spot + slow stoch attached)
one may paper-trade for some days, to confirm & build confidence.. REMEMBER, THESE INDICATORS ARE SECONDARY... MAIN FOCUS SHOULD BE ON THE INTRADAY NIFTY FUT CHART & YOUR LEVELS...
i would rate these indicators 90% on success ratio... but it's only with experience, one can use such indicators accurately...
slow stoch + RSI + RSR level of NIFTY FUT
- a lethal combination to enter a position...
http://www.traderji.com/attachments...406-nifty-futures-trading-intraday-stochs.png
Thanx for an excellent explanation!!!!
Sunil, please clarify about the chart posted!!! It does not match the chart I have for the corresponding period!!
Would like to have your comment on use of Inside bar for smaller time frame :
Say in 5 minutes chart we have 3 consecutive inside bars, i.e. one bar followed by 3 bars within the same range of this first bar, would such a set up ideal for trading as suggested in 60 min. perspective!!! Would be more of a scalping!!!
Regards
R K Karnani
TF being reduced to 5 minutes....
many chances of inside bar appearing frequently
1. too many cooks spoil the broth
2. main aim of inside bar breakout is targeting H2 or L2 (as explained)... now if the diff between H1 & H2, for example, is more than 10 points (in your case of 5 min chart), then try it & see... but, i really doubt if such diff would exist... as i said, inside bars are meant for higher TFs (actually for EOD analysis)... i m experimenting with 60 min charts (at max, 30 min)... not below that TF...
my personal view... but i would appreciate your experiment with 5 min TF and its results
| Thread starter | Similar threads | Forum | Replies | Date |
|---|---|---|---|---|
|
|
My trade setups | Trading Diary | 85 | |
| T | Long-term and Short-term Setups | Technical Analysis | 25 | |
| N | Simple Candlestick Chart Setups | Technical Analysis | 0 | |
| Q | Suggest resources to find detailed trade setups | Technical Analysis | 0 | |
| S | Sharing my trades with proper trade setups | Futures | 146 |
Similar threads
-

-
-
-
Suggest resources to find detailed trade setups
- Started by quantalerts
- Replies: 0
-