


Hi Guys,
How do you protect yourself from these fake reversals?
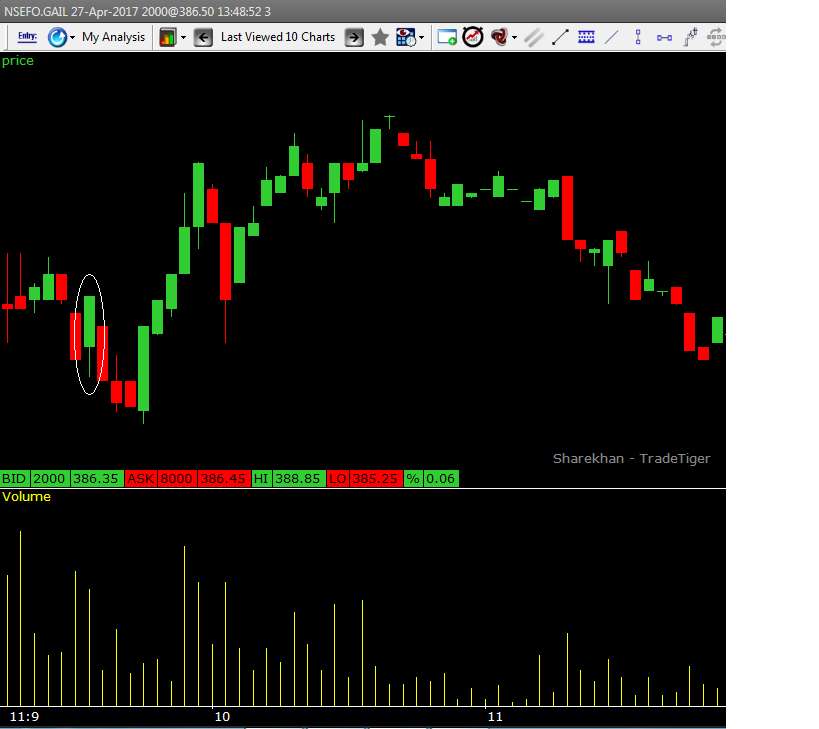
The above chart is from Gail April 11th date, April-27-Future.
See the circled candle (7th one from beginning) which is a bullish engulfing with good volume as well. Someone who goes short in the previous candle will possibly exit. But after the fake bullish engulfing finishes, the trend continues downwards further, and you hit your head, as why you exited.

How to know, if this reversal is fake or a genuine one, so as to hold the position.