


sbi analysis
- Thread starter abhi1985
- Start date
Hi ABHI,
Excellent chart analysis and maintenance of Wave count. It's one of the best trendline analysis I've seen.
I'm curious do you use any other indicators for confirmation? For e.g. just to make sure the wave 4 is really wave 4 and not A(Retrospectively I see there was an upside breakout.) But still to be sure I'd recommend using volume and 63-Day ROC to confirm it. Why 63 day? Because it smoothens out Wave 3 spikes and weekly volatility. This helps in spotting true divergencea
Also what I feel is Elliot Wave Theory count becomes easier on Weekly data.
Also to make entry/exit in the Wave, a moving average is required.
There you've my analysis and methods I'd use. My friend I'd love to hear your views. Also by evening I'll post my analysis base on above suggestions.
Have fun and thank you so much for the opportunity to share.
Dear Abhi, Its an excellent chart. From tomorrow onwards we might see its correcting waves. Now they have started charging for customers for this & that. today I came to know that now onwards they are going to charge customers for using locker also. Only 12 times in a year are free and if you open your locker for more than 12 times then customer is liable to pay. Looks like SBI management gone stupid. They will see its effect in its share price and in the coming quarters. lol. Anyway technical is aligned for correction. Cheers
Last edited:
Dear John,
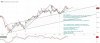
Sorry for the delay I was caught in some personal work. But here I'm and my take on SBI. On Wednesday the 5th wave was confirmed on different time frame. But there was an odd spike on wave 3. The second peak though made a higher high but the ROC showed lag in wave 3 it shouldn't happen and the subsequent correction was made on heavy volume indicating some heavy selling. But then if we count the zig zag bar then Wave 3 looks like ABC which is not possible. Hence logically it could be counted as Wave 5 but then wave 5 cannot be so short when wave 3 though powerful but not so long enough to create protracted 5. Here weekly charts come in handy. It smoothened out the spike.
As for your analysis of SBI falling tomorrow I agree with you. There would be sideways movement because the stock is overbought as confirmed by 5-day EMA. But nothing beyond 20 Day EMA.
Benefit of using 63 Day ROC. On 14Day ROC you'll find there is a huge divergence between current breakout above 280. This can be taken as bearish sign. But
If you check the 63 day ROC you'll find the breakout. Hence you'd not be chasing false divergence.
Thanks for your valuable time.


 For your perusal I've added links to the charts
Sorry for the delay I was caught in some personal work. But here I'm and my take on SBI. On Wednesday the 5th wave was confirmed on different time frame. But there was an odd spike on wave 3. The second peak though made a higher high but the ROC showed lag in wave 3 it shouldn't happen and the subsequent correction was made on heavy volume indicating some heavy selling. But then if we count the zig zag bar then Wave 3 looks like ABC which is not possible. Hence logically it could be counted as Wave 5 but then wave 5 cannot be so short when wave 3 though powerful but not so long enough to create protracted 5. Here weekly charts come in handy. It smoothened out the spike.
As for your analysis of SBI falling tomorrow I agree with you. There would be sideways movement because the stock is overbought as confirmed by 5-day EMA. But nothing beyond 20 Day EMA.
Benefit of using 63 Day ROC. On 14Day ROC you'll find there is a huge divergence between current breakout above 280. This can be taken as bearish sign. But
If you check the 63 day ROC you'll find the breakout. Hence you'd not be chasing false divergence.
Thanks for your valuable time.
Dear John,
Sorry for the delay I was caught in some personal work. But here I'm and my take on SBI. On Wednesday the 5th wave was confirmed on different time frame. But there was an odd spike on wave 3. The second peak though made a higher high but the ROC showed lag in wave 3 it shouldn't happen and the subsequent correction was made on heavy volume indicating some heavy selling. But then if we count the zig zag bar then Wave 3 looks like ABC which is not possible. Hence logically it could be counted as Wave 5 but then wave 5 cannot be so short when wave 3 though powerful but not so long enough to create protracted 5. Here weekly charts come in handy. It smoothened out the spike.
As for your analysis of SBI falling tomorrow I agree with you. There would be sideways movement because the stock is overbought as confirmed by 5-day EMA. But nothing beyond 20 Day EMA.
Benefit of using 63 Day ROC. On 14Day ROC you'll find there is a huge divergence between current breakout above 280. This can be taken as bearish sign. But
If you check the 63 day ROC you'll find the breakout. Hence you'd not be chasing false divergence.
Thanks for your valuable time.
For your perusal I've added links to the charts
Sorry for the delay I was caught in some personal work. But here I'm and my take on SBI. On Wednesday the 5th wave was confirmed on different time frame. But there was an odd spike on wave 3. The second peak though made a higher high but the ROC showed lag in wave 3 it shouldn't happen and the subsequent correction was made on heavy volume indicating some heavy selling. But then if we count the zig zag bar then Wave 3 looks like ABC which is not possible. Hence logically it could be counted as Wave 5 but then wave 5 cannot be so short when wave 3 though powerful but not so long enough to create protracted 5. Here weekly charts come in handy. It smoothened out the spike.
As for your analysis of SBI falling tomorrow I agree with you. There would be sideways movement because the stock is overbought as confirmed by 5-day EMA. But nothing beyond 20 Day EMA.
Benefit of using 63 Day ROC. On 14Day ROC you'll find there is a huge divergence between current breakout above 280. This can be taken as bearish sign. But
If you check the 63 day ROC you'll find the breakout. Hence you'd not be chasing false divergence.
Thanks for your valuable time.
Hi John,
The idea is this ROC and Momentum indicator calculate the magnitude of the price movement. Ideally in a reliable and good uptrend each peak should form quicker then the last peak. Hence the momentum should not show any divergence from pek. As I said in last post. The 14 day ROC fails to register the 3 extended move and instead shows the stock had peaked before and this upmove could be a bearish B wave correction move. But by using 63 day ROC it has been conclusively observed that there is 1 more peak left for this stock
The idea is this ROC and Momentum indicator calculate the magnitude of the price movement. Ideally in a reliable and good uptrend each peak should form quicker then the last peak. Hence the momentum should not show any divergence from pek. As I said in last post. The 14 day ROC fails to register the 3 extended move and instead shows the stock had peaked before and this upmove could be a bearish B wave correction move. But by using 63 day ROC it has been conclusively observed that there is 1 more peak left for this stock


Similar threads
-
-
Is it worth to continue SBI Magnum mid cap fund?
- Started by Mvelarasu
- Replies: 2
-
SBI loaning $1bn to Adani coal mine - Good idea?
- Started by ArmaanJJ
- Replies: 3
-
-
Will Yes Bank’s price fall to 10 per share once SBI buys shares at Rs10?
- Started by Nitya12
- Replies: 13