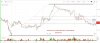
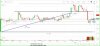
"who grasps principles " thanks sir understand your message , can you please give focus on it , means what principal should follow for a new trader. and more,after complete chart , trend visual is clear but during market hour's it difficult to understand , so my main query was as intraday how to defined trend ?
The best resource i have found is Adam H Grimes, his 1st book and blog ( and etc ) is really great. The patterns he trades are the best way( and only way for me) that i have been able to use to be able to understand trends/ranges/Momentum/price action etc. Even then it will take time to use that and test/create your trading plan. There is a lot of fuzziness in trends and reversals, everything is only in terms of probabilities.
Multiple Failures at start is almost a guarantee i think ( even if your start with Grimes' book). If you can persist through those then maybe after some time you might see some progress.
Even if you dont look at it at first, try to stay in touch with the blog and podcast.
There is a lot of superstition around trading as well. Fibonacci etc don't really add value and are just a distraction. Not any more useful than simply using a Measured Move objection or saying that a pullback generally retraces say 25-75% of the impulse.