PRICE ACTION : No indicators, patterns and theories. Just price.

#21
sir reference line create as intraday basis or derive from previous few days history or from option data
Dear Sujan,
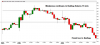
Please do away with Sir, we all are students here. Henceforth address me as Vinod. Coming to your query, I would say reference line is something which you arrive at after lots of observation of charts. I choose my reference line from past few sessions price behaviour. I guess there are traders who use options open interest data to arrive at areas where they are confident of placing their trades. I am always in the process of collecting more evidence that cements my interpretation of the market movement. Always remember you are up against a decidedly more formidable entity which profits from your losses. As you learn to be more observant and patient you learn to see through how the market behaves. During turbulent times volatility increases and that is the time to stay put and avoid trades or else you burn your fingers. Have a look at HDFCBANK futures chart below. I have given an explanation on why we need to wait for areas to be respected instead of assuming they will be respected and jumping into trades.

1545142437976.png

Regards,
 
#23
Dear Timepass,
My criteria is the change in behavior above a certain price point or area. In case of Nifty futures 10850 satisfies the criteria. In my earlier posts I had mentioned that above 10850 bull territory begins(EOD basis). It simply means the bulls will be more active above 10850 and will try to protect it. Do not look at candle patterns but look at individual candles and where they close. I have also mentioned that price action is applicable across most standard time frames i.e 5min, 15min, 60 mins, EOD. So irrespective of the general trend one can have a short to very short term perspective and still trade with success. Have a look at today's Bank Nifty futures chart below and you will get an idea of what I mean. I know it looks confusing without the reference line. However as you learn to observe longer with patience you wont even need the reference line.

1545155461036.png
Regards.
 
#24
Good morning friends. If you co-relate today's up move with yesterdays Banknifty chart you can appreciate the continuation in Banknifty and Nifty futures.
Some more live evidence in Bajfinance chart below. This is just an example do not trade this move as we have not yet discussed about targets and stop loss as per this methodology.

1545195837249.png
Regards.
 
#27
More evidence of Price action in Ibulhsg futures. Kindly observe how the prices retreat from 865-66 levels. As the stock completes a big rally and traders start booking profit, shorts come into play as well. Again no indicators, patterns or volume.

ibulhsg 15min chart.png


Ibulhsg futures as the session progresses. The circle at 845-847 levels shows failure to hold on to levels for reversal. So next obvious direction is towards the day low.

1545380574029.png


Ibulhsg futures hit fresh day low.

1545380763278.png


Regards.
 

Attachments

Last edited:
#29
brother one query , how to choose stock for next day trade which is most probability to move at least 2%. right now i have watch list of 5 stock including NITY & BNF , but problem is some times have to seat 1 week or more without any trade
 
#30
brother one query , how to choose stock for next day trade which is most probability to move at least 2%. right now i have watch list of 5 stock including NITY & BNF , but problem is some times have to seat 1 week or more without any trade
Dear Sujan,
Since I have no idea about the way you trade ( day trader, swing trader, positional trader ) I would simply suggest a method which fits in price action. Price action is demand and supply at levels ( created by markets ). With change in sentiment demand and supply keeps changing. In other words support (demand) becomes resistance (supply) and vice versa. If you were to study a chart of any time time frame you will find many areas from where the prices move but all these areas do not qualify as areas where you can initiate a succesful trade. My suggestion is to revisit the charts and observe more minutely. Below is an example of 5 min chart and 15 min chart of Bajfinance futures ( its a way to track movement ) . In hindsight when the trading session is over and you have all the data on chart it seems very easy. However, during live markets, when you are waiting for the next move of the market, it is challenging as you do not have complete data. What you need to understand is that how beyond a particular point marked as R (resistance) the market reacts and how it turns into an S (support). Also notice the amount of time required as the market tests the support and resistance level. Even intra day trading requires patience. Hope you find this useful.

1546075630108.png


1546075689486.png


Regards.
 

Similar threads