


Hi,
*Apologies in advance; English is not my native language...
Im struggling to calculate, normalize and compare a Relative Strength (not RSI) ratio for chosen stocks vs. the S&P500 index.
As far as I understand from the multiple articles I have read on this topic, the RS ratio is calculated by dividing an individual stock value by chosen index value (alternatively, by dividing a particular stock's percent change value by desired index percent change value for the same period). Then, the RS values and graphs of different stocks (that were correlated with the same index and period) can be compared.
Questions/Problems -
1. What is your best practice for calculating the RS ratios (stock vs. index)? Can anyone refer to a reliable data source/explain the difference between the two methods:
1.1 stock_price / index_price
1.2 percent_change_stock / precent_change_index
* Also, how does the time period variable affect the section 1.1 RS results?
2. How can I normalize the stocks' RS ratios to compare them?
The RS values and the graphs I get from both methods (the above 1.1, 1.2) cannot be compared between various stocks. The RS values of some stocks are on the x.0 scale, of other stocks are on the 0.x scale, of other stocks are on the 0.0000x scale, etc.
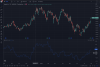
My goal is to get the same results as the graph below.
Trading view settings for AAPL stock: module to compare = "relative strength" or "relative strength of a stock". Period 50 days.
Thank you!
*Apologies in advance; English is not my native language...
Im struggling to calculate, normalize and compare a Relative Strength (not RSI) ratio for chosen stocks vs. the S&P500 index.
As far as I understand from the multiple articles I have read on this topic, the RS ratio is calculated by dividing an individual stock value by chosen index value (alternatively, by dividing a particular stock's percent change value by desired index percent change value for the same period). Then, the RS values and graphs of different stocks (that were correlated with the same index and period) can be compared.
Questions/Problems -
1. What is your best practice for calculating the RS ratios (stock vs. index)? Can anyone refer to a reliable data source/explain the difference between the two methods:
1.1 stock_price / index_price
1.2 percent_change_stock / precent_change_index
* Also, how does the time period variable affect the section 1.1 RS results?
2. How can I normalize the stocks' RS ratios to compare them?
The RS values and the graphs I get from both methods (the above 1.1, 1.2) cannot be compared between various stocks. The RS values of some stocks are on the x.0 scale, of other stocks are on the 0.x scale, of other stocks are on the 0.0000x scale, etc.
My goal is to get the same results as the graph below.
Trading view settings for AAPL stock: module to compare = "relative strength" or "relative strength of a stock". Period 50 days.
Thank you!
Attachments
-
 611.5 KB Views: 52