


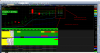
Nifty Levels for 21 July 2020
- Thread starter OptimSignals
- Start date
- Tags nifty trading nifty trading levels nifty trading strategy nifty trading system nifty trading tips

| Thread starter | Similar threads | Forum | Replies | Date |
|---|---|---|---|---|
|
|
NIFTY Weekly levels DEC 5-8 2022 DEC Future | Futures | 1 | |
| S | Nifty intra day - angular movement levels | Derivatives | 7 | |
| T | Daily Nifty Levels ( Best if it can be auto traded ) any suggestions ? | Futures | 0 | |
| P | Nifty levels | Day Trading | 0 | |
|
|
Tamil Trader- Nifty Daily Levels for Bulls and Bears | Day Trading | 4 |
Similar threads
-

-
-
Daily Nifty Levels ( Best if it can be auto traded ) any suggestions ?
- Started by tradingforbusyguys
- Replies: 0
-
-
