Nifty analysis for 18 July 2006

#1
Disclaimer: These are my personal thoughts and not trading advise.
http://www.traderji.com/attachment.php?attachmentid=1984&stc=1&d=1153244214
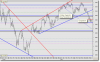
The Nifty went into a congestion zone today. As expected, the mood remained bearish, though we did see bouts of buying.
Please remember, whatever is being discussed here is based on the hourly chart, and should be adhered to on the same time frame.
We could maintain the 2970 and 3010 levels as benchmarks for tomorrow, which could decide the short term trends for the next few days. The intermediate term trend is positively down.
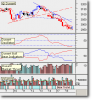
The second chart http://www.traderji.com/attachment.php?attachmentid=1985&stc=1&d=1153244214 shows the more conventional (personal) analysis, which I normally follow, which suggests that we could have a couple of days, where the Nifty could test the overhead resistances.
Let us see how it behaves at those overhead resistances, if it manages to remain positive tomorrow onwards.
One of the reasons why I feel bullish is that there has been a dramatic shift in the open interest of the Nifty Futures.
 

Attachments

Last edited:
#3
MARKET LIEKLY TO RISE TO TO 3659 LEVEL

ELLIOT WAVE THEORY WISE THERE IS ONE OF THE POSSIBILTY THAT NIFTY IS UNDERGOING ABC CORRECTION
.

Todays working of nifty is quite interesting if you check Fibonacci levels held by nifty.
The rise from low of nifty 2596 to 3201 was almost 23.3% from 2596 (3201-2596=605 points in terms of percentage rise 23.3.% from the bottom of 2596 on 14/6/2006).After hitting the 3201 mark nifty reacted to low level of 3057 about 145point fall .The first low level of 3057 was almost at Fibonacci correction level of 23.6% of the total rise of 605 points from low level and then bounce back to almost 3208 and now fall to 2968 today .Now check this level of 2968! This is again 1.618 times fall of 145 points.The recent first fall from nifty 3201 to 3057 can be considered as wave a of larger degree wave B and rise to 3208 again can be considered as wave b(Irregular top) of larger wave B and what we have witnessed in last four days can be considered as wave c of larger wave B.Wave a and c are also related by Fibonacci number that is wave c is normally 1.618 times, 235 points of wave a ,145 points (a typical example of ABC correction where wave c at times is 1.618 times of wave a specially when we have irregular correction of wave b )
If we consider above wave markings then we are in for good times from tomorrow onward and may be, we will witness Market testing the top made in May 2006 of 3775 level.

The working is as under for the nifty correction

Wave A =605 points from low level of 2596 or 23.3% %rise from that level
Wave B= 605*.382 of wave A ,
Subtract this from the top of wave A of larger wave 3201-232=2968) market touched the low of 2968and bounced back from that level.
Normally wave A and C are equal in time and amplitude if the correction is flat coorection. Considering the flat correction the wave C should rise by 23.3 % from the low of 2968 i.e. the top of wave C should be 2968*1.233=3659
Robert Prectcheter in his book on Elliot wave describes wave C as killing wave or fastest wave since it is the third wave, so one can expect good rise in the market and nifty can cross the most talked level of 3375/3400 .
Ramesh Parikh.
 
#5
rameshparikh said:
MARKET LIEKLY TO RISE TO TO 3659 LEVEL

ELLIOT WAVE THEORY WISE THERE IS ONE OF THE POSSIBILTY THAT NIFTY IS UNDERGOING ABC CORRECTION
.

Todays working of nifty is quite interesting if you check Fibonacci levels held by nifty.
The rise from low of nifty 2596 to 3201 was almost 23.3% from 2596 (3201-2596=605 points in terms of percentage rise 23.3.% from the bottom of 2596 on 14/6/2006).After hitting the 3201 mark nifty reacted to low level of 3057 about 145point fall .The first low level of 3057 was almost at Fibonacci correction level of 23.6% of the total rise of 605 points from low level and then bounce back to almost 3208 and now fall to 2968 today .Now check this level of 2968! This is again 1.618 times fall of 145 points.The recent first fall from nifty 3201 to 3057 can be considered as wave a of larger degree wave B and rise to 3208 again can be considered as wave b(Irregular top) of larger wave B and what we have witnessed in last four days can be considered as wave c of larger wave B.Wave a and c are also related by Fibonacci number that is wave c is normally 1.618 times, 235 points of wave a ,145 points (a typical example of ABC correction where wave c at times is 1.618 times of wave a specially when we have irregular correction of wave b )
If we consider above wave markings then we are in for good times from tomorrow onward and may be, we will witness Market testing the top made in May 2006 of 3775 level.

The working is as under for the nifty correction

Wave A =605 points from low level of 2596 or 23.3% %rise from that level
Wave B= 605*.382 of wave A ,
Subtract this from the top of wave A of larger wave 3201-232=2968) market touched the low of 2968and bounced back from that level.
Normally wave A and C are equal in time and amplitude if the correction is flat coorection. Considering the flat correction the wave C should rise by 23.3 % from the low of 2968 i.e. the top of wave C should be 2968*1.233=3659
Robert Prectcheter in his book on Elliot wave describes wave C as killing wave or fastest wave since it is the third wave, so one can expect good rise in the market and nifty can cross the most talked level of 3375/3400 .
Ramesh Parikh.
My very humble observation of the market is that if we allow ourselves to be swayed by any type of analysis, be it Elliott, Golden Ratio, Gann, Wyckoff et al, we approach the market with a pre-determined mind set.
Which does not allow us to answer two basic questions.

What if I am right?

What if I am wrong?

I would rather follow the market, as I am a inconsequential minnow, trying to feed off the remains of the sharks.

Dusant
 
#6
One question for Ramesh Parikh wud u care to define this whole movement from 2596 in terms of wave form and not stick to pure fibonacci.
Because from 27th june low to 3208 and subsequent retracement to 2967 is 78.1%. and from; low of 21/6 is 61.8
Regards
Amit.
 
#7
Dusant said:
My very humble observation of the market is that if we allow ourselves to be swayed by any type of analysis, be it Elliott, Golden Ratio, Gann, Wyckoff et al, we approach the market with a pre-determined mind set.
Which does not allow us to answer two basic questions.

What if I am right?

What if I am wrong?

I would rather follow the market, as I am a inconsequential minnow, trying to feed off the remains of the sharks.

Dusant
Very nice Dusant........very nice.Great to have you around here.A very warm welcome to you,and I am sure your experience and wisdom will be of great benefit to everyone here.

Looking fwd to ur posts.

Sincerely,
Saint
 
#9
Dusant said:
My very humble observation of the market is that if we allow ourselves to be swayed by any type of analysis, be it Elliott, Golden Ratio, Gann, Wyckoff et al, we approach the market with a pre-determined mind set.
Which does not allow us to answer two basic questions.

What if I am right?

What if I am wrong?

I would rather follow the market, as I am a inconsequential minnow, trying to feed off the remains of the sharks.

Dusant
Dusant,

you are absoultely right. If we looks at charts with a pre-conceived notion, the the results would be disastrous.

like, when we are in Buy, we want the chart to say everything is positive. The same is opposite when we are in sell.

I remember the old story of the Witch saying to mirror.

Mirror, Mirror, Who do look a like? The mirror says you are beautiful, eventhought the witch is old and ugly.

So, lets not make our charts as the witch's mirror.

Always, thin un biased and looks for the negatives against your positions.

Satya
 

Similar threads