Natural gas positional target 254 -266

#1
Bump-and-Run Reversal [ EOD Analysis]

 
#3
Natural gas if hold below 225 -224 level exit natural gas long positions

why ????? Yes natural gas again try to test below 200 level

we enter long after some times....
 
#4
Made high : 254.00
 
#5
04/09/2013 Economic Data

Time :10:30 Indian HSBC Services PMI Previous 47.9

overview :-


The Indian HSBC Services PMI is compiled by questionnaires sent to purchasing executives in around 350 private service sector companies. The panel has been carefully selected to accurately replicate the true structure of the services economy. Index and the Services Business Activity Index, and is based on original survey data collected from a representative panel of over 800 companies based in the Indian manufacturing and service sectors.

A higher than expected reading should be taken as positive/bullish for the INR , while a lower than expected reading should be taken as negative/bearish for the INR.

Time :3.00 Indian M3 Money Supply Previous 12.20%

overview :-


Monetary aggregates, known also as "money supply", is the quantity of currency available within the economy to purchase goods and services. M3 is a broad monetary aggregate that includes all physical currency circulating in the economy (banknotes and coins), operational deposits in central bank, money in current accounts, saving accounts, money market deposits, certificates of deposit, all other deposits and repurchase agreements.

A higher than expected reading should be taken as positive/bullish for the INR , while a lower than expected reading should be taken as negative/bearish for the INR.
 

DSM

Well-Known Member
#6
Re: 04/09/2013 Economic Data

Thanks Santhosh, very informative...

Time :10:30 Indian HSBC Services PMI Previous 47.9

overview :-


The Indian HSBC Services PMI is compiled by questionnaires sent to purchasing executives in around 350 private service sector companies. The panel has been carefully selected to accurately replicate the true structure of the services economy. Index and the Services Business Activity Index, and is based on original survey data collected from a representative panel of over 800 companies based in the Indian manufacturing and service sectors.

A higher than expected reading should be taken as positive/bullish for the INR , while a lower than expected reading should be taken as negative/bearish for the INR.

Time :3.00 Indian M3 Money Supply Previous 12.20%

overview :-


Monetary aggregates, known also as "money supply", is the quantity of currency available within the economy to purchase goods and services. M3 is a broad monetary aggregate that includes all physical currency circulating in the economy (banknotes and coins), operational deposits in central bank, money in current accounts, saving accounts, money market deposits, certificates of deposit, all other deposits and repurchase agreements.

A higher than expected reading should be taken as positive/bullish for the INR , while a lower than expected reading should be taken as negative/bearish for the INR.
 
#7
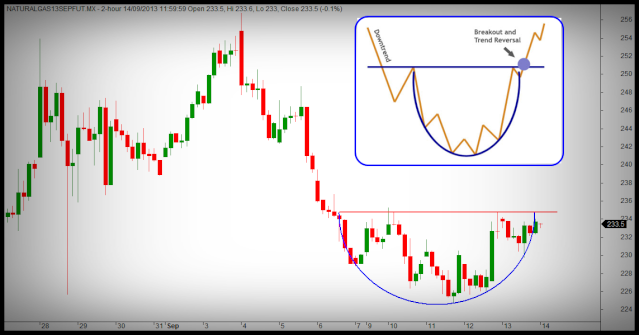
Naturalgas positional analysis 14/09/2013


Naturalgas~ positional analysis

Buy Naturalgas above 235.00

Targets : 247.00 - 253.00

Stoploss : 229.00

Note :- This is my personal view only,take positions with your own analysis...
~~~~~~~~~~~~~~~~~~~~~~~~~~~~~~~~~~
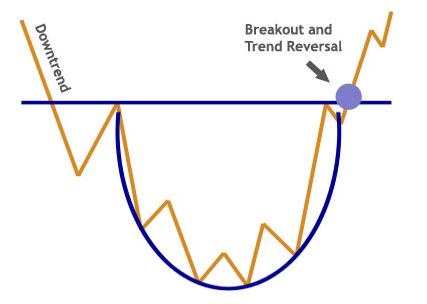
Rounding Bottom

The rounding bottom is a U-shaped bottom, also called "saucer. " The dip is very rounded with a flat bottom. However, we see in many cases several bearish peaks but they do not put in question the validity of the pattern.

The neckline of the pattern is formed by the highest point prior to the formation of the U.

Here is a graphical representation of a rounding bottom:


Rounding Bottom

There is no theoretical target price. Some authors measure the depth of the U and report it on the neckline like on a double bottom for example. However, it is not advisable to apply this method, indeed the target is then reach in only 36% of cases. The theoretical objective that is recommended is to measure the depth of the U and then divide by 2, to postpone this height on the neckline.

The rounding bottom has been lengthily considered as a reversal pattern. However, the work of T. Bulkowski showed that in many cases the rounding bottom is a continuation pattern. However, when the neckline is broken, the results are very good.

Statistiques

Here are some statistics about the rounding bottom:

- In 62% of cases, there is a bullish reversal
- In 86% of cases, the exit is upward
- In 57% of cases, the target advised for this pattern is reached
- In 40% of cases, a pullback occur on the neckline
- In 95% of cases, there is a pursuit of the bullish movement after the breakout of the neckline

Notes

- The price often makes a break when the price gets back on the neckline

- More the dip is flat, more the movement at the breakout of the neckline will be strong

- If there is a pullback on the neckline after the breakout, the upward movement will be then less powerful

- If a significant upward spike occur after the formation of the bottom, it is possible to draw a downward line to connect the high point prior to the formation of the rounding bottom and the highest of the bullish peak.

Rounding Bottom

Trading Strategies

The classic strategy :

Entry: Take a long position at the breakout of the neckline
Stop: The stop is placed below the neckline
Target: Theoretical target of the pattern
Advantage: A lot of lows are made during the upward movement leading to the neckline so it's easy to set your stop
Disadvantage: Due to an accumulation zone shaping below the neckline, the breakout can be violent and so a large part of the movement could be lost.

The agressive strategy :
Entry: Take a long position at the breakout the bearish slant (example above)
Stop: The stop is placed below the last lowest
Target: Return on the neckline
Advantage: The ratio profit/risk is high because the stop is close
Disadvantage: The pattern is not yet confirmed and so the percentage of a losing trade is higher
 
#8
 
#9
 

Similar threads