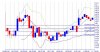
* IVRCLINFRA * Triangulation short.
Nice chart, till a couple of days back it would look like the corrective waves are over and its taking support on the trendline.. then this !!!
Is it because 5 distict waves down is a sign of a downtrend ? as opposed to three waves would be a correction downside ?
Visualize this chart two - four days ago and excercise cuation on long setups of the kind.
I saw this stock around 22/09/2010 in discussion with someone, technically, the swings indicate an uptrend and a thrid wave, my contention at thepoint was - what looks like the first upswing does not 'look impulsive' so even tho a HH and HL were formed, i took no bullish stand on it.
HH and HLs combinations are essentially Elliotts and Elliotts are essentially HH and HL combinations however, so do keep an eye out for IMPULSIVE first rises, it *has* to be an *impulisve rise*, else just assume to the safer end and consider it a correction to a downtrend.