


metastock
- Thread starter r_sajnani
- Start date
Check out this article on Option Volatility
Here is the Metastock formula:
Historical Volatility Daily
MetaStock Indicator
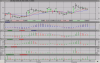
With MetaStock for Windows, you can easily plot the 10 and 100 day Historical Volatility. First use the Indicator Builder to enter the following Custom indicators:
Historical Volatility 10 day
--------------------------------------------------------------------------------
Std(Log(C/Ref(C,-1)),10)*Sqrt(365)*100
Historical Volatility 100 day
--------------------------------------------------------------------------------
Std(Log(C/Ref(C,-1)),100)*Sqrt(365)*100
--------------------------------------------------------------------------------
Next plot both indicators in the same inner window. If the Scaling Options dialog appears, choose the Merge with Scale on Right (or left) option.
It may be easier for some to see the Historical Volatility signals by combining the 10 and 100 day indicators into the following indicator.
Historical Volatility Indicator
--------------------------------------------------------------------------------
Std(Log(C/Ref(C,-1)),10)/Std(Log(C/Ref(C,-1)),100)
--------------------------------------------------------------------------------
Plot this indicator in MetaStock for Windows, then click your mouse button on the indicator. Choose Historical Volatility Indicator Properties and then choose the Horizontal Lines page. Add a horizontal line at .5 and then choose the OK button. You now know the 10 period volatility is less than half the 100 period volatility anytime this indicator crosses below its horizontal line.
To test trading systems using this indicator it would he helpful to use the alert function along with a trend following indicator, such as the following example:
Enter Long: Cross(CLOSE,Mov(C,20,E)) AND Alert(Fml("Historical Volatility Indicator")<=5,10)
Enter Short: Cross(Mov(C,20,E),CLOSE) AND Alert(Fml("Historical Volatility Indicator")<=5,10)
This system will enter a long trade when the close has crossed above its 20 day moving average, and when Historical Volatility Indicator was .5 or lower within the last 10 days. The system will sell when the close crosses below its 20 day moving average, and when Historical Volatility Indicator was .5 or lower within the last 10 days. Use any indicator you would like, this just provides a basic example of how to use this indicator in a system test.
Here is the Metastock formula:
Historical Volatility Daily
MetaStock Indicator
With MetaStock for Windows, you can easily plot the 10 and 100 day Historical Volatility. First use the Indicator Builder to enter the following Custom indicators:
Historical Volatility 10 day
--------------------------------------------------------------------------------
Std(Log(C/Ref(C,-1)),10)*Sqrt(365)*100
Historical Volatility 100 day
--------------------------------------------------------------------------------
Std(Log(C/Ref(C,-1)),100)*Sqrt(365)*100
--------------------------------------------------------------------------------
Next plot both indicators in the same inner window. If the Scaling Options dialog appears, choose the Merge with Scale on Right (or left) option.
It may be easier for some to see the Historical Volatility signals by combining the 10 and 100 day indicators into the following indicator.
Historical Volatility Indicator
--------------------------------------------------------------------------------
Std(Log(C/Ref(C,-1)),10)/Std(Log(C/Ref(C,-1)),100)
--------------------------------------------------------------------------------
Plot this indicator in MetaStock for Windows, then click your mouse button on the indicator. Choose Historical Volatility Indicator Properties and then choose the Horizontal Lines page. Add a horizontal line at .5 and then choose the OK button. You now know the 10 period volatility is less than half the 100 period volatility anytime this indicator crosses below its horizontal line.
To test trading systems using this indicator it would he helpful to use the alert function along with a trend following indicator, such as the following example:
Enter Long: Cross(CLOSE,Mov(C,20,E)) AND Alert(Fml("Historical Volatility Indicator")<=5,10)
Enter Short: Cross(Mov(C,20,E),CLOSE) AND Alert(Fml("Historical Volatility Indicator")<=5,10)
This system will enter a long trade when the close has crossed above its 20 day moving average, and when Historical Volatility Indicator was .5 or lower within the last 10 days. The system will sell when the close crosses below its 20 day moving average, and when Historical Volatility Indicator was .5 or lower within the last 10 days. Use any indicator you would like, this just provides a basic example of how to use this indicator in a system test.
What is volatility?
Volatility is a statistical measure of the tendency of a market or security to rise or fall sharply within a short period of time. Volatility is typically measured by the standard deviation of the return of an investment. Standard deviation is a statistical concept that denotes the amount of variation or deviation that might be expected. For example, the BSE 500 has a standard deviation around 15% while a guaranteed investment like a bank account has a standard deviation of zero because the return never varies.
Volatile markets are characterized by wide price fluctuations and heavy trading. They often result from an imbalance of trade orders in one direction (for example, all buys and no sells). Some say volatile markets are caused by things like company news, a recommendation from a well known analyst, a popular IPO, or unexpected earnings results. Others blame volatility on day traders, short sellers, and institutional investors. One explanation that is gaining steam is that investor reactions are caused by psychological forces. This theory flies in the face of efficient market hypothesis (EMH), which says prices are right and reflect all pat information. This behavioral approach says that substantial price changes (volatility) result from a collective change of mind by the investing public. It's clear there is no consensus on what causes volatility and probably never will be. The fact is, though, that volatility exists and investors must develop ways to deal with it.
this site has tooooooo many formulas.....however verify them before using :
http://trader.online.pl/index.html
http://trader.online.pl/index.html
Hello all, In regards to having too many formulas etc... I would highly suggest to check out a product called The Fractals Edge. It seems to be an all in one product that calculates everything automatically. All you have to do is read the data and make your buying or selling decision. You can see it at the following link. www.thefractalsedge.com
I will be purchasing this within the next week after I get back from my trip in Las Vegas. I will be going there to see the Las Vegas Traders Expo which will have a Quantum Futures, TFE Meta Stock, and The Fractals Edge. I hope to see all the new stuff they have to offer and will share what I see with you all here upon my return.
I tried the MetaStock just today and didnt like it. It was very Klunky to work with. Not smooth and took too much time to learn. So far I am not very impressed with what I see. I still like the simpleness of The Fractals Edge better so far.
SwampDoc
swampdoc said:
H
I tried the MetaStock just today and didnt like it. It was very Klunky to work with. Not smooth and took too much time to learn. So far I am not very impressed with what I see. I still like the simpleness of The Fractals Edge better so far.
SwampDoc
I tried the MetaStock just today and didnt like it. It was very Klunky to work with. Not smooth and took too much time to learn. So far I am not very impressed with what I see. I still like the simpleness of The Fractals Edge better so far.
SwampDoc

| Thread starter | Similar threads | Forum | Replies | Date |
|---|---|---|---|---|
| S | prev metastock convert to afl | AmiBroker | 0 | |
| S | Metastock 15-16-17 | MetaStock | 0 | |
|
|
looking for historical cash eod data for metastock | End of Day | 1 | |
| H | Metastock | MetaStock | 1 | |
| A | Please help me convert this indicator to metastock | MetaStock | 0 |