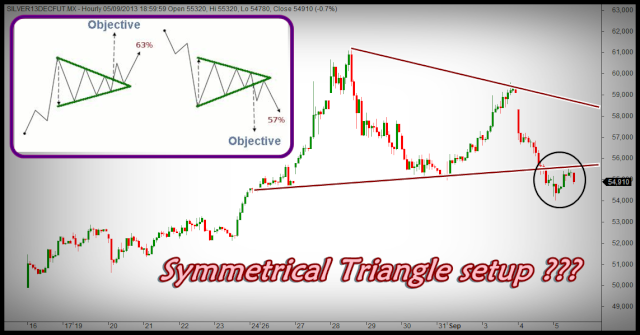
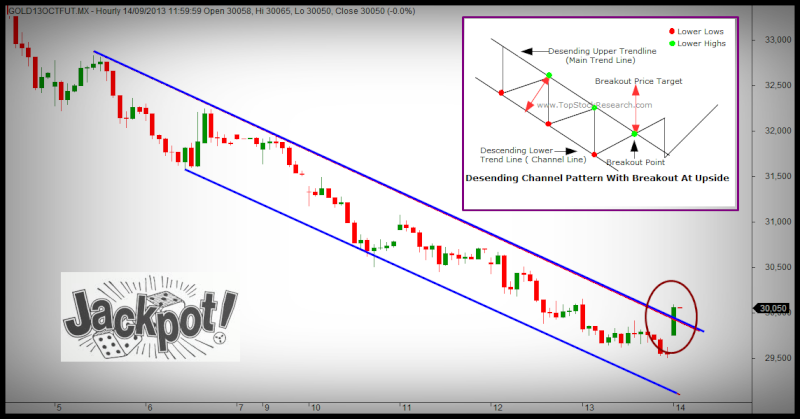
Gold Master candle setup Target : 33488 [vimalraj]
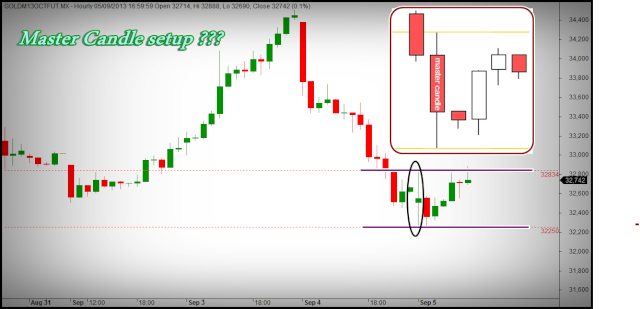
Gold Master candle setup Target : 33488 ???
High risky traders buy gold around : 32740 -32500 level
Safe traders buy only above : 32840 ( need to candle close )
Stoploss : 32240
Target : 33488 may be possible ....But book at you wish...
Note :- This is my personal view only,Take positions with your own analysis...
++++++++++++++++++++++++++++++++++++++++++++++++++++++++++++++++++++++
Master Candle
What is a Master Candle?
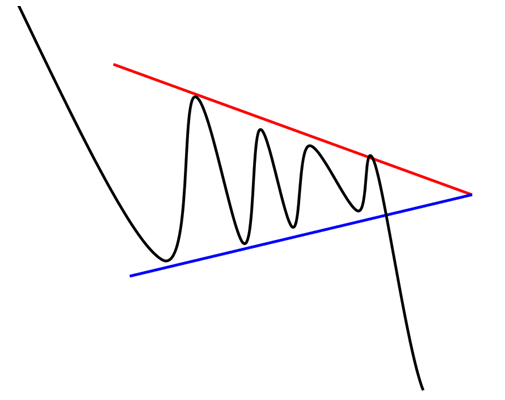
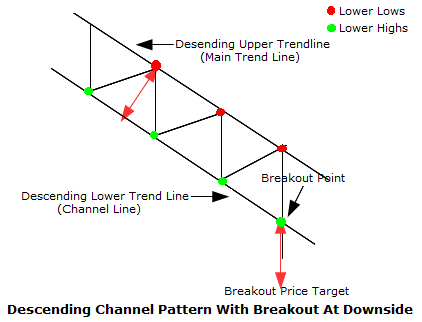
A master candle forms when a large candle makes a recent high and low that engulfs the following four or more candles. Take a look at the example below:

The minimum number of candles the master candle needs to engulf is four, but the more the better. When a master candle forms it is an area of support and resistance being set.
Why Are They Useful and What Do They Mean?
I find it is easiest to think of master candles as mini scalp lines. The high and low of the master candle represent recent areas of support and resistance. As candles form within the boundaries of the master candle the areas of support and resistance grow stronger. So trading master candles is like trading scalp lines or range breaks. The market falls into a range that is dictated by the high and low of the master candle. Once that high or low is broken the market
should rally. The more time before the break the stronger those boundaries become. Think about a master candle as a cross between support + resistance lines and candle patterns.
How Accurate are They?
Like any form of technical analysis, if you trade it alone and you blindly jump in without thinking you will lose. These patterns only work if the trader using them has a brain and is willing to use some discretion. A trading method only works if a real trader is trading it. So master candles can be as accurate as giving you 8 wins in every 10 trades using them. However, this will only be true if you use them in conjunction with other forms of analysis, common sense, and your brain.
What Makes a Strong Master Candle?
As with any form of analysis, some signals can be stronger than others. For example, when trading scalp lines a scalp line that has had three very strong, recent bounces is stronger than a scalp line with one weak bounce.
Let’s look at some of the things that make a master candle stronger:
1. Line Bounces
We know that the more bounces a scalp or support + resistance line has the stronger the line becomes. This is simply because every time the price
bounces away from that level it shows us that the level is a strong barrier. The more it bounces the stronger that barrier becomes. So when the price manages to eventually break that barrier it makes for a much better trade.
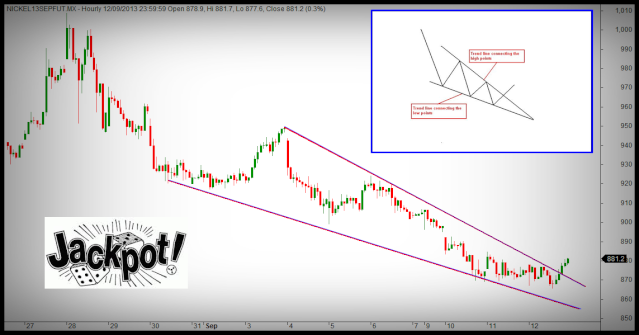
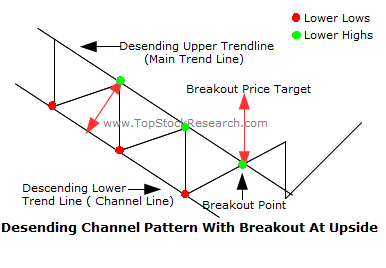
If the candles within the master candle bounce off of the high or low of the master candle it makes that high or low stronger. Therefore, a break of that high or low should make for a better trade, as the price should have a stronger than normal rally. Take a look at this example below:

Looking at the picture above you can see what I mean. The candles trapped within the boundaries of the master candle keep on testing the resistance lines. The more times the price rejects that line the stronger the line becomes.
2. Scalp or Support + Resistance Lines
If the master candles high or low happens to form on a pre existing scalp or support resistance line then that line becomes stronger. It becomes stronger because more than one form of analysis points to the same line being an area of support or resistance.
3. Psychological Levels
Same as above, if the master candles high or low happens to form on a strong psychological level Iwould consider the line stronger.
4. Time
The longer the master candle holds out the stronger it becomes. However, if it holds for too long I might consider it invalid. I give it about 24 hours to break. If it cannot break in 24 hours I scrap the master candle.
5. New highs or lows
If the high or low of a master candle doubles as a new daily, weekly, monthly, yearly or all time high or low it obviously makes the master candle stronger. Here is an example:

As you can see the master candle that formed on the 5th of December formed a new yearly low. I
would consider that line stronger than the line up top. This is just common sense.
So depending on how and where they form some master candles can be stronger than others.

This is so straight forward I do not know if it can be explained any more. The master candle forms a high and a low. When that high or low is broken the entry is triggered. However, as usual this breakout trading is a little different than most types of breakout trading. I like to use my brain when entering a breakout trade. I do not robotically enter the moment the line is broken. There are several factors that dictate whether or not I get into a trade, and if I get into the trade, when I get in.
Targets and Stops
Master candles are very subjective. Targets depend on where/when they form, market conditions, and line strength. Obviously if the master candles low forms on top of a strong support + resistance line the target on the break will be larger.
Gold Master candle setup Target : 33488 ???
High risky traders buy gold around : 32740 -32500 level
Safe traders buy only above : 32840 ( need to candle close )
Stoploss : 32240
Target : 33488 may be possible ....But book at you wish...
Note :- This is my personal view only,Take positions with your own analysis...
++++++++++++++++++++++++++++++++++++++++++++++++++++++++++++++++++++++
Master Candle
What is a Master Candle?
A master candle forms when a large candle makes a recent high and low that engulfs the following four or more candles. Take a look at the example below:
The minimum number of candles the master candle needs to engulf is four, but the more the better. When a master candle forms it is an area of support and resistance being set.
Why Are They Useful and What Do They Mean?
I find it is easiest to think of master candles as mini scalp lines. The high and low of the master candle represent recent areas of support and resistance. As candles form within the boundaries of the master candle the areas of support and resistance grow stronger. So trading master candles is like trading scalp lines or range breaks. The market falls into a range that is dictated by the high and low of the master candle. Once that high or low is broken the market
should rally. The more time before the break the stronger those boundaries become. Think about a master candle as a cross between support + resistance lines and candle patterns.
How Accurate are They?
Like any form of technical analysis, if you trade it alone and you blindly jump in without thinking you will lose. These patterns only work if the trader using them has a brain and is willing to use some discretion. A trading method only works if a real trader is trading it. So master candles can be as accurate as giving you 8 wins in every 10 trades using them. However, this will only be true if you use them in conjunction with other forms of analysis, common sense, and your brain.
What Makes a Strong Master Candle?
As with any form of analysis, some signals can be stronger than others. For example, when trading scalp lines a scalp line that has had three very strong, recent bounces is stronger than a scalp line with one weak bounce.
Let’s look at some of the things that make a master candle stronger:
1. Line Bounces
We know that the more bounces a scalp or support + resistance line has the stronger the line becomes. This is simply because every time the price
bounces away from that level it shows us that the level is a strong barrier. The more it bounces the stronger that barrier becomes. So when the price manages to eventually break that barrier it makes for a much better trade.
If the candles within the master candle bounce off of the high or low of the master candle it makes that high or low stronger. Therefore, a break of that high or low should make for a better trade, as the price should have a stronger than normal rally. Take a look at this example below:
Looking at the picture above you can see what I mean. The candles trapped within the boundaries of the master candle keep on testing the resistance lines. The more times the price rejects that line the stronger the line becomes.
2. Scalp or Support + Resistance Lines
If the master candles high or low happens to form on a pre existing scalp or support resistance line then that line becomes stronger. It becomes stronger because more than one form of analysis points to the same line being an area of support or resistance.
3. Psychological Levels
Same as above, if the master candles high or low happens to form on a strong psychological level Iwould consider the line stronger.
4. Time
The longer the master candle holds out the stronger it becomes. However, if it holds for too long I might consider it invalid. I give it about 24 hours to break. If it cannot break in 24 hours I scrap the master candle.
5. New highs or lows
If the high or low of a master candle doubles as a new daily, weekly, monthly, yearly or all time high or low it obviously makes the master candle stronger. Here is an example:
As you can see the master candle that formed on the 5th of December formed a new yearly low. I
would consider that line stronger than the line up top. This is just common sense.
So depending on how and where they form some master candles can be stronger than others.
This is so straight forward I do not know if it can be explained any more. The master candle forms a high and a low. When that high or low is broken the entry is triggered. However, as usual this breakout trading is a little different than most types of breakout trading. I like to use my brain when entering a breakout trade. I do not robotically enter the moment the line is broken. There are several factors that dictate whether or not I get into a trade, and if I get into the trade, when I get in.
Targets and Stops
Master candles are very subjective. Targets depend on where/when they form, market conditions, and line strength. Obviously if the master candles low forms on top of a strong support + resistance line the target on the break will be larger.
Last edited: