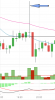
Is this a Shooting star or an Inverted hammer in Crude?

newtrader101

Well-Known Member
#1
Crude has formed this candle in the hourly, followed by a bullish candle today at 19:00.
1531844278418.png


However in the 5 minutes chart it has formed this candle (below), followed by a bearish candle.


So what is it, a bullish reversal signal or bearish continuation?
 

Attachments

Last edited:

sanju005ind

Investor, Option Writer
#5
Crude has formed this candle in the hourly, followed by a bullish candle today at 19:00.
View attachment 26668

However in the 5 minutes chart it has formed this candle (below), followed by a bearish candle.


So what is it, a bullish reversal signal or bearish continuation?
Candles should be interpreted in the context of the whole chart. Single candle wont tell anything.That candle just shows that Sellers were more in that time frame.Please post the complete chart with TF. Reversal candle patterns are valid in when they occur after a nice trend and more valid when they occur near a support or resistance zone.
 

newtrader101

Well-Known Member
#6
Candles should be interpreted in the context of the whole chart. Single candle wont tell anything.That candle just shows that Sellers were more in that time frame.Please post the complete chart with TF. Reversal candle patterns are valid in when they occur after a nice trend and more valid when they occur near a support or resistance zone.
Its a one hour chart.
 

sanju005ind

Investor, Option Writer
#7
Its a one hour chart.
I posting the 1 Hr Chart. Though we are interpreting with the benefit of hindsight.I hope the highlighed yellow candle is the one you were talking about.I would call it an inverted hammer which came in an uptrend.It was rejected near the weekly R2 Pivot Red line.The subsequent candle also could not close above it.Hence if you were long that was the time go get out.The inverted hammer came with big volume indicating the strong selling.Though there was no short entry because the MACD was in +Ve and and RSI greater than 70 and the candles still closed above the 5 EMA and VWAP. Location of a candle patter is more important. Here it was near Weekly R2. You may not trade pivots.But other traders migh.Hence should watch carefully whenever prices are near such levels.

1535421628939.png
 

sanju005ind

Investor, Option Writer
#8
Oh I think I posted the wrong time chart.
Going by your char i see that it being rejected near Pivot level along with the moving average as well.Your 5 min chart also tells the same story and your MACD is negative. the following green candles would be a normal pullback. Do not be too tied up with the names of the candle.Just imagine what happened during that time.price went up all the way but sellers were able to push it down.
 

newtrader101

Well-Known Member
#9
Oh I think I posted the wrong time chart.
Going by your char i see that it being rejected near Pivot level along with the moving average as well.Your 5 min chart also tells the same story and your MACD is negative. the following green candles would be a normal pullback. Do not be too tied up with the names of the candle.Just imagine what happened during that time.price went up all the way but sellers were able to push it down.
It made a 200+ point upmove after that candle.
 

Similar threads