


Hi guys,
Please see the 2 charts attached below. I was just going through HINDALCO's candle and line charts upto June 3 closing and I have a doubt.
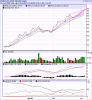
Lets go by the line chart first:
A trend channel formation is seen in the last 7-10 sessions. The volume have increased towards the recent sessions. So is there a possibility of breakout in very near term? Also, I doubt that a pennant formation already broke out last days of May. This fits in more correctly because the volume accompanying that breakout are in line with expected trend.
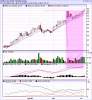
Now, coming to the candle chart:
Is there an ascending triangle formation. Going by the "support and resistance" concept, one can see the price touching the resistance line and retreating for there a no. of times. But if you look at the volumes, I feel slightly confused because the volume does not show the expected trend of decreasing.
Is this an example of some close overlapping of two patterns in the almost same timeframe? Irrespective of what the pattern is, I thin we can expect more upward price action")
Thank you.
Please see the 2 charts attached below. I was just going through HINDALCO's candle and line charts upto June 3 closing and I have a doubt.
Lets go by the line chart first:
A trend channel formation is seen in the last 7-10 sessions. The volume have increased towards the recent sessions. So is there a possibility of breakout in very near term? Also, I doubt that a pennant formation already broke out last days of May. This fits in more correctly because the volume accompanying that breakout are in line with expected trend.
Now, coming to the candle chart:
Is there an ascending triangle formation. Going by the "support and resistance" concept, one can see the price touching the resistance line and retreating for there a no. of times. But if you look at the volumes, I feel slightly confused because the volume does not show the expected trend of decreasing.
Is this an example of some close overlapping of two patterns in the almost same timeframe? Irrespective of what the pattern is, I thin we can expect more upward price action
Thank you.
Attachments
-
 33.2 KB Views: 35
 -
 33.7 KB Views: 34
Last edited: