Hi @CougarTrader I tried checking this particular issue with IB support as well. The hourly chart on TWS has issues. The first candle is 9:15 to 9:30 and then the rest of candles are 9:30 to 10:30 and so on..i was checking for NFITY...they said its by design and i need to raise a feature request. I said, what the hell!! this is basics of charting. Do you see the same ?


Interactive Brokers (India)
- Thread starter CougarTrader
- Start date
Hi @CougarTrader I tried checking this particular issue with IB support as well. The hourly chart on TWS has issues. The first candle is 9:15 to 9:30 and then the rest of candles are 9:30 to 10:30 and so on..i was checking for NFITY...they said its by design and i need to raise a feature request. I said, what the hell!! this is basics of charting. Do you see the same ?
I also see the same behavior. Perhaps it is to align with the market closing time of 3.30 pm.
If you check TradingView Hourly charts, the first candle starts at 9:15, next at 10:15, so on each candles shows 1 hour OHLC quotes but the last candle starting at 15:15 only contains 15 minutes of OHLC quotes (45 mins missing).
In TWS first bar is considered to adjust this aberration of 15 minutes. This is not an issue, in some places you will notice the last bar being compromised and in some places the first.
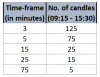
It appears wrong because our market opens at 09:15 and trades for 375 minutes. Since our markets trade for 375 minutes, 60 minutes charts will not procure correct analysis - even for a SMA - as an aberration of 15 minutes will either appear first or on last bar.
Technically, the correct "intraday" time-frames applicable for us are 3 mins, 5 mins, 15 mins, 25 mins and 75 minutes. Why? Because 3, 5, 15, 25, 75 are factors of 375. Each of these timeframes would produce all candles with quotes of equal and consistent time-span. Hence, correct charts!
(click on image to expand)
This is what I do in AmiBroker:
From Tools > Preferences > "Intraday" tab, check "Align minute bars to regular market hours".
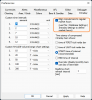
And the market hours are set as usual in Database settings > Intraday Settings, like so:
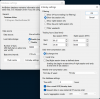
Please notice that custom "75 minutes" is being used for below chart. Every trading day contains equal number of 5 candles each of equal 75 minutes:
P.S. Glad that you asked this question @iTrade, because many don't even bother at these critical nitty-gritties. You got sensitive eyes, brother! All the best.... keep on... This is one of the reasons, why it becomes ultra-critical that one learns to code own charts as per own needs. Only we ourselves know what we actually need!
")
Last edited:
Agreed! Well explained @CougarTrader and thank you for taking out time for the same..I was right to tag you for the question
Whatever you're doing is working for you, please continue doing so!
Specifically, in "my" case, broker related issues used to disturb a lot; mostly platform-related issues, petty-issues in the name of regulators, lack of common-sense, being irresponsible, not taking ownership of a situation conducive to their own faults, or, using sophisticated fallacies to churn extra fees/charges, etc.
Then, found IBKR. Partnership with IBKR works well for "me", neither vouching nor claiming in any way for "others"! Leaving that to you to decide!
Bottom line is that unless & until you've found a consistent way of staying profitable, only throwing the onus on brokers (or on others) won't yield anything.
A "consistent plan" is key to survival in the markets. If one holds a well choreographed plan (encompassing all market conditions) and gives ample time, would be able to relate to what I am attempting to indicate.
Sharing "my take" (your thoughts might differ) on above mentioned challenges:
With IBKR it is essential that one understands Key Margin Definitions (please note that the percentages mentioned there are with respect to U.S. and S.E.C. which does not apply to Indian markets, however, the essence remains same).
IBKR is fully in-tune with NSE requirements. Matter of fact, wayyyyy better and well-organised than others in terms margin management and of-course you get your right "a stable OMS". Yes, "stable OMS/RMS" even on any volatile day.
Before placing any order you may Check Margin Pre-Order. After position is acquired you may view real-time margin requirements, also consider what's available for trading.
Now let us do one comparison!
A broker only allows 1:1 mapping - for each Sold option, one can buy equal far-OTM option only. Hence, initially one needs to maintain full "sell" margin to instantiate a hedged postion. That too, with lots of ifs-and-buts for buying far OTM options.

(an example only)
With IBKR one can instantiate the same postion with the Final Margin only (~ ₹40,000). Just complete all buy legs first, then sell - reduced margin to apply automatically from the onset of the position. Even on existing positions, (especially on expiry-days) one may buy far-far-OTMs, reduce margin substantially, then sell far-OTM, book the balance safely! Sleep peacefully...
Sharing "my take" (your thoughts might differ) on above mentioned challenges:
1) High margin requirements than NSE stipulated on Futures and Sold Option positions
IBKR is fully in-tune with NSE requirements. Matter of fact, wayyyyy better and well-organised than others in terms margin management and of-course you get your right "a stable OMS". Yes, "stable OMS/RMS" even on any volatile day.
Before placing any order you may Check Margin Pre-Order. After position is acquired you may view real-time margin requirements, also consider what's available for trading.
Now let us do one comparison!
A broker only allows 1:1 mapping - for each Sold option, one can buy equal far-OTM option only. Hence, initially one needs to maintain full "sell" margin to instantiate a hedged postion. That too, with lots of ifs-and-buts for buying far OTM options.
(an example only)
With IBKR one can instantiate the same postion with the Final Margin only (~ ₹40,000). Just complete all buy legs first, then sell - reduced margin to apply automatically from the onset of the position. Even on existing positions, (especially on expiry-days) one may buy far-far-OTMs, reduce margin substantially, then sell far-OTM, book the balance safely! Sleep peacefully...
2) No provision for margin against pledged collateral
One might completely disagree but honestly, "I do not like pledging core capital" for trading, because:
1) haircut - meaning the amount that I would potentially earn over time is always unusable to me. Often the haircut is way more than the potential to be gained.
2) pledging shares or equity-linked underlying is very risky as the value itself may depreciate and in Debt MFs the return is peanuts. On contrary had the amount being deployed raw for hedging would yield more when compounded over time. Please consider doing the maths w.r.t. your favourite instrument for pledging!
3) Broker & Exchange collateral MAS delist risk - any fine morning, these guys may wake up to decide the underlying that you pledged is ineligible for collateral margin. Lo and behold, by the time you settle, enjoy incurring margin shortfall penalty.
Pledging core capital is too risky "for me".
3) Inadequate customer service
For APIs or understanding their feature-rich TWS platform better go through IBKR YouTube Channel and refer User Manual first. India customer service, although supportive, do not (superficially) handhold clients owing to staffing. In case you are wondering meaning of "superficial hand-holding", I meant taking remote of Client PC, installing platform, giving demo of features, attempting to convince - IBKR does not do that! This is the only broker I've come across who strictly adhere to their SOP.
However, administrative wise I've never faced any issues after account opening. IBKR India proactively sends email prior to anything related to your account and any (bulletin, notice) pertaining to our markets.
Also go through IBKR India Investor Charter explaining things much better.
Last edited:
4) Quarterly settlement
SEBI does not want anyone to keep more than 225% of required margin on position lying ideal with broker.
Similar threads
-
Amibroker buy/sell -> IBControler -> TWS (Interactive Brokers) /// too many orders submitted
- Started by PolTrader37
- Replies: 2
-
-
-
Interactive Brokers India Telegram group
- Started by DrDrakeRamoray
- Replies: 0
-
Review of Interactive Brokers (India)
- Started by umesh_ladha
- Replies: 15