


INDIA: A BEAR MARKET?
Everyday we hear economists, analyst and media persons trying hard to find answer to a common question: is india in bear market. They are trying hard to find the elusive bottom of this ongoing market correction. Investors are trying hard to find value picks in this correction and those who were battered by this downturn are trying hard to find a respectable exit to minimize their losses. Those traders who had their trading plans, and entries and exits in place were spared by this savage correction. Because it do not matter to them as their job is to trade the markets whether they go up or down.
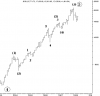
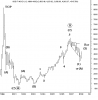
After a long time I am bringing my Elliott wave analysis to you. I will describe my both bullish and bearish scenarios and then go in brief discussing two other markets china , USA and gold . Bearish Wave Count: BSE sensex started its final leg of bull market, the fifth primary wave in April, 2003 at the low of 2904.44. The first intermediate wave (1) was completed at the high of 6249.6 in January 2004. Then retraced the rise in intermediate wave (2) upto 4227.5 which was a deep correction retracing a fibbonacci approx. 61.8% level. From may 2004 we saw an extended intermediate wave (3) which culminated at 14723.88 level in February 2007 which is more than 262% Fibonacci level when compared with wave (1). The wave (4) was rather shallow but permitted under Elliott guidelines of alternations. Remember wave(2) was a deep correction and this alternates with shallow wave (4) correction. This wave(4) retraced wave(3) slightely less than 23.6%. The final intermediate wave(5) which started in march 2007 went on to achieve the top at 21206.77 to complete the bull market . This wave was just short of 61.8% ratio of combined wave length of wave(1)and wave(3). With this wave (5) sensex completed the fifth and final primary wave of a higher cycle degree wave. Thus if our completed wave analysis is correct then we are in a cycle degree bear market and this is just the start of a bearmarket which will be bigger than any of the bearmarkets we have seen from the 1980 when sensex started trading. This offers tremendous opportunity to traders on the short side and will inflict huge losses to the investor who believes this correction is just another correction and a buying opportunity.
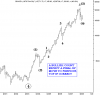
THE BULL CASE: What is the alternate count if I am wrong? At most optimist case the alternate count points to intermediate wave (5) beginning from recent lows of 14677. But so far I fail to
count it as an impulse wave. But still if we are in final (5)th the possible target is previous high.
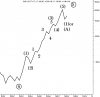
INTERNATIONAL MARKETS: These too seems to have formed significant tops and are moving up in an overlapping manner. China has completed the first primary wave up and is now correcting in primary wave two as can be seen from the chart. Dow has completed the cycle wave b and is now correcting down in cycle wave c. Finally the Gold seems to have formed bullmarket top at $1033 and correcting hard. Inference is that the corrective bounce we are witnessing in many of the markets will be over soon and the larger downtrend will resume in a week or two.
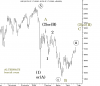
BSE IT INDEX: A few words about bse IT index. As a sector we hear lots of voices telling us that the IT sector has bottomed out and should be the first to move up. On analysis this index I found IT was one of the first sectors to make a significant corrective top in 2007. In fact like nasdaq composite it was never in a implusive up move but correcting the sevsere down wave A that followed the tech bubble top in 2000 . Now, whether it forms massive triangle or an implsive wave C on the downside will become clear in the future but it is not in a new up move as is being opined in many circles.
Everyday we hear economists, analyst and media persons trying hard to find answer to a common question: is india in bear market. They are trying hard to find the elusive bottom of this ongoing market correction. Investors are trying hard to find value picks in this correction and those who were battered by this downturn are trying hard to find a respectable exit to minimize their losses. Those traders who had their trading plans, and entries and exits in place were spared by this savage correction. Because it do not matter to them as their job is to trade the markets whether they go up or down.
After a long time I am bringing my Elliott wave analysis to you. I will describe my both bullish and bearish scenarios and then go in brief discussing two other markets china , USA and gold . Bearish Wave Count: BSE sensex started its final leg of bull market, the fifth primary wave in April, 2003 at the low of 2904.44. The first intermediate wave (1) was completed at the high of 6249.6 in January 2004. Then retraced the rise in intermediate wave (2) upto 4227.5 which was a deep correction retracing a fibbonacci approx. 61.8% level. From may 2004 we saw an extended intermediate wave (3) which culminated at 14723.88 level in February 2007 which is more than 262% Fibonacci level when compared with wave (1). The wave (4) was rather shallow but permitted under Elliott guidelines of alternations. Remember wave(2) was a deep correction and this alternates with shallow wave (4) correction. This wave(4) retraced wave(3) slightely less than 23.6%. The final intermediate wave(5) which started in march 2007 went on to achieve the top at 21206.77 to complete the bull market . This wave was just short of 61.8% ratio of combined wave length of wave(1)and wave(3). With this wave (5) sensex completed the fifth and final primary wave of a higher cycle degree wave. Thus if our completed wave analysis is correct then we are in a cycle degree bear market and this is just the start of a bearmarket which will be bigger than any of the bearmarkets we have seen from the 1980 when sensex started trading. This offers tremendous opportunity to traders on the short side and will inflict huge losses to the investor who believes this correction is just another correction and a buying opportunity.
THE BULL CASE: What is the alternate count if I am wrong? At most optimist case the alternate count points to intermediate wave (5) beginning from recent lows of 14677. But so far I fail to
count it as an impulse wave. But still if we are in final (5)th the possible target is previous high.
INTERNATIONAL MARKETS: These too seems to have formed significant tops and are moving up in an overlapping manner. China has completed the first primary wave up and is now correcting in primary wave two as can be seen from the chart. Dow has completed the cycle wave b and is now correcting down in cycle wave c. Finally the Gold seems to have formed bullmarket top at $1033 and correcting hard. Inference is that the corrective bounce we are witnessing in many of the markets will be over soon and the larger downtrend will resume in a week or two.
BSE IT INDEX: A few words about bse IT index. As a sector we hear lots of voices telling us that the IT sector has bottomed out and should be the first to move up. On analysis this index I found IT was one of the first sectors to make a significant corrective top in 2007. In fact like nasdaq composite it was never in a implusive up move but correcting the sevsere down wave A that followed the tech bubble top in 2000 . Now, whether it forms massive triangle or an implsive wave C on the downside will become clear in the future but it is not in a new up move as is being opined in many circles.
Attachments
-
 14.7 KB Views: 121
 -
 17.2 KB Views: 94
 -
 15.6 KB Views: 78
 -
 23.2 KB Views: 74
 -
 14.7 KB Views: 67
")