


Hi,
I am not a coder but I do know how to code in bits and pieces to make my quick & dirty application for any task that I am trying to automate. In 2016 I started reading about derivatives and wanted to trade options.
As options are non linear instruments I see that many things go into picking an option, like to decide when to sell/buy and what options to buy/sell we have to consider spot price/volatility, Greeks, time and IV etc along with appropriate strike. Based on this, I needed to calculate many things for options along with technical analysis of the spot to initiate a trade with high probability. Initially I used EXCEL to do all my calculations but it was very slow and as so many dimensions are to an option, I was not able to quickly update the sheets manually. So I decided to work on a web based app but could not complete. Recently I got some time and decided to complete the same.
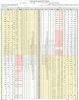
I have built an app which can work on the historical EOD data for any stock (fetch automatically if not present already), its FnO derivatives and compute the Greeks, Implied volatility and the trend of volatility for every option (chain) and save in a database.
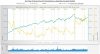
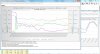
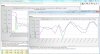
Right now I am regarding the IV and its trend for an option's lifetime and also the IV trend for x number of strike away from ATM to understand if it is trading at a premium or not and see if volatility will cool or not. These charts can help in analyzing the costliness of an option.
The reason for putting that importance on IV trend is because delta, gamma are dependent on the spot movement and position of spot wrt strike, theta is in one directional and rho does not even matter in such short periods of expiry. IV can really affect the premium which can be analysed in details.
As any type of chart and view can be built if we have the data, please share if you have any suggestions for manipulating the historical data and help me understand if there can be another view/chart that can visually assist to make decisions for initiating an options trade. I will implement the same in my study.
I am attaching some screenshots of my webapp. Currently it is hosted in my laptop, if it is useful, I can try to migrate online. Since the database is really huge, it will require some powerful servers. . Anyways right now I am storing the data for all FnO segment stocks (spot), all futures instruments, for options: BANKNIFTY, NIFTY, SBIN, INFY, RELIANCE, TCS, TATASTEEL, TATAMOTORS, MARUTI, PNB, FORTIS and DLF. However, it can be done for any FnO instrument.
I am not a coder but I do know how to code in bits and pieces to make my quick & dirty application for any task that I am trying to automate. In 2016 I started reading about derivatives and wanted to trade options.
As options are non linear instruments I see that many things go into picking an option, like to decide when to sell/buy and what options to buy/sell we have to consider spot price/volatility, Greeks, time and IV etc along with appropriate strike. Based on this, I needed to calculate many things for options along with technical analysis of the spot to initiate a trade with high probability. Initially I used EXCEL to do all my calculations but it was very slow and as so many dimensions are to an option, I was not able to quickly update the sheets manually. So I decided to work on a web based app but could not complete. Recently I got some time and decided to complete the same.
I have built an app which can work on the historical EOD data for any stock (fetch automatically if not present already), its FnO derivatives and compute the Greeks, Implied volatility and the trend of volatility for every option (chain) and save in a database.
Right now I am regarding the IV and its trend for an option's lifetime and also the IV trend for x number of strike away from ATM to understand if it is trading at a premium or not and see if volatility will cool or not. These charts can help in analyzing the costliness of an option.
The reason for putting that importance on IV trend is because delta, gamma are dependent on the spot movement and position of spot wrt strike, theta is in one directional and rho does not even matter in such short periods of expiry. IV can really affect the premium which can be analysed in details.
As any type of chart and view can be built if we have the data, please share if you have any suggestions for manipulating the historical data and help me understand if there can be another view/chart that can visually assist to make decisions for initiating an options trade. I will implement the same in my study.
I am attaching some screenshots of my webapp. Currently it is hosted in my laptop, if it is useful, I can try to migrate online. Since the database is really huge, it will require some powerful servers.
. Anyways right now I am storing the data for all FnO segment stocks (spot), all futures instruments, for options: BANKNIFTY, NIFTY, SBIN, INFY, RELIANCE, TCS, TATASTEEL, TATAMOTORS, MARUTI, PNB, FORTIS and DLF. However, it can be done for any FnO instrument.
Last edited:
