Elliottwave count for SENSEX

hi Amit,
May be a possibility . But if a wave is a flat then it also
carry the possibilty of completed wave 4 as well. Moreover
I am not very sure about this.
vinay
 
joy_verma said:
hi gvn,
correct . it's 1992 not 1991. with regard to your wave B query here
is what Tom denham wrote to me :

''Thank you for sharing the view of the RBI Share Index. it seems to me that our overall wave counts are comparable. I would have counted the September 1994 top of the RBI as a completed fifth wave at the time, but in light of later developments in the Sensex, I think it was a swing within an ongoing triangle. When I look the monthly bar chart to the September 1994 peak, I count seven waves, so it does make a good corrective swing.''

Regarding your third query see the attached image.
vinay
thanks vinay for sharing tom denham's and your views.that was really great learning experience.:)

regards,
gvnarendra.
 
hello vinay,

this alternate count can be thought of to put nifty and sensex in similar lines but also can keep the whole view same, which you have mentioned.see the intraday chart which shows the movement of the nifty after may 17 2004 crash.it shows a leading diagonal being formed.if we take this as the 1st minor wave of intermediate wave 3 mentioned by you, then minor wave 2 got over in late june 2004, after that 3rd minor wave extended which got completed in may 2006.so the count may also be done as shown in the chart.

one thing which i forgot to ask was , what was the reason behind reducing the wave count by one degree.

regards,
gvnarendra.
 

Attachments

Hi Vinayji,sorry to bother You again,its a gr8 learning curve for me as it is unfolding,probably one in a lifetime(of cyclical dimensions).These are my alternate observations.Kindly advice.
1)We actually started this correction at 3555 on 7th April,the A wave took to 3290 and B got a 161.8% retracement to 3774(3 wave affair).This C became the last leg.So we may have already bottomed out.The F2 data from Pankaj's thread lends credence too.They were exiting from april.
2)We may have completed one leg of the correction at 2595 and we are in for a B wave whose minimum target is 3050 now 38.2% retracement.
Pls treat this as a request to add on more to my observations.
Regards
Amit.
PS is it possible to get important dates out of elliot analysis.Curiously I have been able to get out important dates.:confused: :eek: :)
 
Hi Amit,
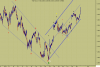
If I consider your first count that will mean an expanded flat
correction. then wave A is smallest wave B is bigger and wave C
biggest. All three are out of proportion size wise . moreover I find
it difficuilt to count five waves from oct.05 low to april 7,06.
your second count is much more probable . thats why it is preferred
count .
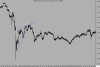
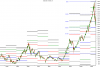
If this correction is over at recent low of 2595, then the best
way to count it is Tony caldaro's count of finished abc(3,3,5). But this 3,3,5 is a configuration of a FLAT. The problem with this wave is the
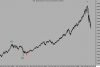
supposed wave b which is too short. In a regular flat abc waves are almost of equal lenghths. still if we have indeed bottomed this possibility is my next best count. why? just look at the weekly chart for answer.

Time imputations : they are much more difficuilt to nail. Still my sense is this
wave b should be over between june27 to july 5,2006 if it is a simple zigzag.
Regards,
vinay
 
Last edited:
Thank You Vinayji.
I was also apprehensive about the Irregular correction,because it was not so visually appealing.
I think the latter is more probable.One has to have alternates.
With the Date thing,I think either 27th or Monday(26th)is an important date.
Can you recommend any other books(to take different perspective on Mr.R.N.Elliot,I have Prechter's book,Beckmans and Neely's e-book).
Thank You again
 
Hi,

The action of week says we are at a crucial stage to finish the corrective wave from 8799 on sensex 2596 on nifty. We are surely in (c) wave of b (circled) if the proposed count for these indices is correct . The natural support on the downside is between 2667 and 2307 for nifty and between 8822 and 7656 on sensex. These areas are previous fourth waves . On the upper side first target area for indices is 50% retracement levels . For nifty this is 3185 and for sensex 10735 . If these levels are convincingly taken out then we may head higher to 62% retracement levels before moving down. My momentum method on hourly charts is already showing weakening signs. Therefore I will be very cautious in the coming week . There are people who are of the opinion that this correction is already over. But in my view untill we go above 11200 level or preferably 11700 level the downside risk will be hanging on our head .
Regards,
vinay
 

Attachments

hello vinay,

in my opinion first three days of the coming week could be a turning point.with fibbonacci time goals,F&o expiry and the US interest rate hike expectations may all take its toll next week.in wave counting the index may be in the 5th wave of wave c of B wave.50 day and 100 day ema coinciding on nifty at around 3128 may act as stiff resistance. to the down an yearly turning point shown on the chart coinciding with 50% retracement of the bull run from may2003 to may2006 may act as stiff support.this comes to around 2530 levels where the market may try to create a base for next up move.regarding time goals in july 3rd week there may be a turning point.

regards,
gvnarendra:)
 

Attachments

Similar threads