


Hello! ")
I thought it's a good time to talk to the group as there were confusing signals about the market direction for the coming days.
Following are my views I have posted in my daily news letter "The Forecaster" for August 31st 2005
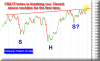
Nifty up-move continues and Nifty tested 2373 during the day and closed at 2367.75. Just a shade below the first hurdle it has to cross if this rally has to sustain. Though volatility yesterday was not as high as it used to be earlier but still a concern. As we are writing here for many days that it is not a good for the bullish markets. We have received a few emails from the new subscribers asking why volatility is a concern as it provides wide swings and good trading opportunities because of decent price fluctuations.
Look this is quite simple to understand. When market decides to move up and gives constant signals in that regards participants get it and keep buying steadily where opportunities are available and law of demand supply moves the market with low volatility as participants are in agreement of its move. To make it clear I would give this example, Calm sea takes you to your destination with your own efforts to sail the ship with little or no support from the wind and waves. You may think that rough sea with high wind and wild waves would make it easier and requires little effort and energy. You may travel long distance with little effort but chances of your survival are remote. Rough sea is considered unsafe even by seasoned fishermen similarly volatility is rough sea of the market hence should be avoided.
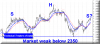
Markets are very delicately poised when IT, PHARMA, FERTILISER and FMCG are showing bullish signs and Nifty is showing bearish pattern. This is quite unusual. Generally we give more weight to index pattern over the individual stocks or sector but this time above sectors have many index heavy weight stocks in it like Infosys Satyam Wipro Ranbaxy Dr. Reddys lab ITC and Reliance. So I am wondering what could drag the index down below 2300 if this pattern to get confirmed. If Nifty moves up to make new highs again and this H&S pattern fails this would be unusual and I have to scan my memory if I have ever noticed such phenomena.
Nifty may turn weak below 2350 and bullish if were to constantly trade above 2377 and finally break free of 2380 hurdle.
There is a possibility that this H&S pattern may fail if CNX IT index and FMCG stocks like ITC breakout. You would come to know of it. First clue will come above 2368.
New Stocks for investment
Buy Stride Acrolab around 304 or above 312. A 80 to 100 rupees move expected if flag get confirmed
Buy Creative eye above 18 target up to 30
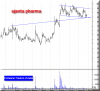
Buy Ajanta Pharma around 86 88 or above 96 stop below 80 target would be 140
Watch out for ITC its range is shrinking for many days. Think it as a squeezing spring. A strong move is on the cards. Above 1720 25 it looks good for 1800 and below 1680 support comes at 1630 only.
Reliance was making a bullish flag on intraday charts. It broke out now and we expect it to make new highs to 830 to 850 if this were the correct pattern we have identified.
Your comments are welcome.
sincerely,
MB Singh
[email protected]
www.technicaltradersofindia.com
I thought it's a good time to talk to the group as there were confusing signals about the market direction for the coming days.
Following are my views I have posted in my daily news letter "The Forecaster" for August 31st 2005
Nifty up-move continues and Nifty tested 2373 during the day and closed at 2367.75. Just a shade below the first hurdle it has to cross if this rally has to sustain. Though volatility yesterday was not as high as it used to be earlier but still a concern. As we are writing here for many days that it is not a good for the bullish markets. We have received a few emails from the new subscribers asking why volatility is a concern as it provides wide swings and good trading opportunities because of decent price fluctuations.
Look this is quite simple to understand. When market decides to move up and gives constant signals in that regards participants get it and keep buying steadily where opportunities are available and law of demand supply moves the market with low volatility as participants are in agreement of its move. To make it clear I would give this example, Calm sea takes you to your destination with your own efforts to sail the ship with little or no support from the wind and waves. You may think that rough sea with high wind and wild waves would make it easier and requires little effort and energy. You may travel long distance with little effort but chances of your survival are remote. Rough sea is considered unsafe even by seasoned fishermen similarly volatility is rough sea of the market hence should be avoided.
Markets are very delicately poised when IT, PHARMA, FERTILISER and FMCG are showing bullish signs and Nifty is showing bearish pattern. This is quite unusual. Generally we give more weight to index pattern over the individual stocks or sector but this time above sectors have many index heavy weight stocks in it like Infosys Satyam Wipro Ranbaxy Dr. Reddys lab ITC and Reliance. So I am wondering what could drag the index down below 2300 if this pattern to get confirmed. If Nifty moves up to make new highs again and this H&S pattern fails this would be unusual and I have to scan my memory if I have ever noticed such phenomena.
Nifty may turn weak below 2350 and bullish if were to constantly trade above 2377 and finally break free of 2380 hurdle.
There is a possibility that this H&S pattern may fail if CNX IT index and FMCG stocks like ITC breakout. You would come to know of it. First clue will come above 2368.
New Stocks for investment
Buy Stride Acrolab around 304 or above 312. A 80 to 100 rupees move expected if flag get confirmed
Buy Creative eye above 18 target up to 30
Buy Ajanta Pharma around 86 88 or above 96 stop below 80 target would be 140
Watch out for ITC its range is shrinking for many days. Think it as a squeezing spring. A strong move is on the cards. Above 1720 25 it looks good for 1800 and below 1680 support comes at 1630 only.
Reliance was making a bullish flag on intraday charts. It broke out now and we expect it to make new highs to 830 to 850 if this were the correct pattern we have identified.
Your comments are welcome.
sincerely,
MB Singh
[email protected]
www.technicaltradersofindia.com
Attachments
-
 20.3 KB Views: 35
 -
 31.5 KB Views: 26
 -
 24.4 KB Views: 35