IMO. he should redraw the lines connecting the tops ( any way we have liberty to deviate few degrees ) so that the break out point appears as a resistance point and wow that becomes great short trade ...
BTW, it was told that we can do it that way.
Whole picture of trading summed up in simple terms (i mean mechanical way) !! my two system ROI is around 62 % and 49 % for F.y 2020-21..there are 4 /3 months of DD in each system !!,scaling could not be done in the way i intended
Whole picture of trading summed up in simple terms (i mean mechanical way) !! my two system ROI is around 62 % and 49 % for F.y 2020-21..there are 4 /3 months of DD in each system !!,scaling could not be done in the way i intended
Even after DD gets beaten we can get drawup and then another drawdown back to previous peak or below. So patience is required.
I use risk as % of capital, so no problem with scaling up apart from market impact. ofc i trade stocks where this is much easier vs futures. Probably above 10 lots, we can imlpement it in futures reasonably too.
Thanks for info..
one help on this if you are currently using it can you please check if your nest version - market watch screen displays iv's for option symbols.
( market watch - add columns - add LTR IV )
Hi
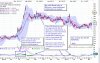
This is the chart of 5Paisa, I analyzed this chart in Jan and was anticipating breakout like shown. But it was a failed breakout.
I would like to know why it failed on that breakout in my chart. it broke out of channel but came back down. why.
Could anyone please help me understand based on their method of analysis,how it could have been sensed as false breakout at the arrow marked in jan.
Thanks View attachment 45886
Hi
This is the chart of 5Paisa, I analyzed this chart in Jan and was anticipating breakout like shown. But it was a failed breakout.
I would like to know why it failed on that breakout in my chart. it broke out of channel but came back down. why.
Could anyone please help me understand based on their method of analysis,how it could have been sensed as false breakout at the arrow marked in jan.
Thanks View attachment 45886
just ltr iv ch or ltr iv fut... anyway you added both to marketwatch ..seems nest here with tradesmart online does not give iv values.
thanks for update..
just ltr iv ch or ltr iv fut... anyway you added both to marketwatch ..seems nest here with tradesmart online does not give iv values.
thanks for update..
")