Dear Jain.er,
Although looking in hindsight its easy to spot trades, but emotions during the same time kills our thinking ability...
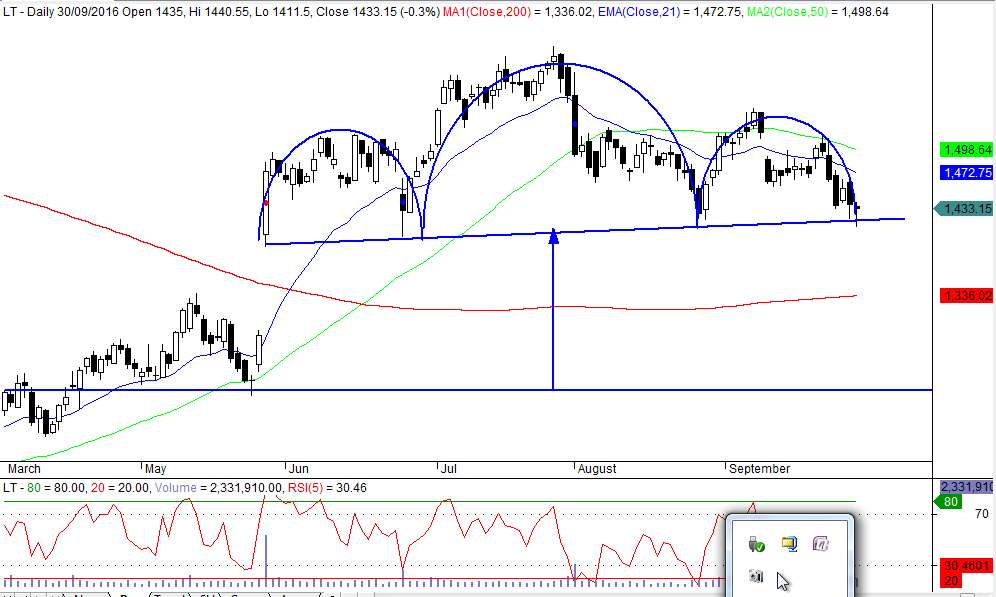
Let me clear it first, the trading/trades below 200 SMA are only good for swing trades with tight stoploss...Nothing wrong to get into those trades, but your capital allocation need to be lesser than what you have for scrip in uptrend...
Once scrip is in uptrend, best to get into pullbacks with nice consolidations or breakouts from the same...
Moving averages here helps us in giving the framework of different timezones interacting at key levels...


")
