


hi.how are you friends.i am posting today about our nifty index.
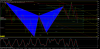
in day chart harmonic patterns appear 10 days before.it first shows
bullish gartley pattern .now it extending towards bullish deep crab.
but in weekly charts it shows bearish bat.and also in monthly charts it shows
bearish gartley well developed.interestingly in day chart it is pretending to be a bullish deep crab.but a bearish TRAP has been laid.i am attaching those patterns with my comments.
Attachments
-
 93.4 KB Views: 198
Last edited:
