


BreakOuts
- Thread starter srisara
- Start date
Thank you SIR for these posts. They are really proving useful to me.
One question : As it appears, you have a convenient way of storing / marking different posts / threads for easy retrieval later. If so, how to do that ? How to store them on your hard-drive (say a complete thread) ? At times I have come across very informative threads but they are now just lost somewhere in this jungle of information. Would appreciate your help on this..
Regards,
Abhay (AAD)
You are very correct about good threads getting buried under flood of posts. I had also expressed this before. I remember this particular thread on Breakouts since I was an active participant in that.
Once idea could be a sticky thread under each main topic whuch priveds the link to the best threads in that section. But that should be a closed thread with traderji or somebody else only adding the threads. Otherwise we will have all many members adding their thread to it.
") Recently I have seen threads with single post with five star rating, probalbly rated by the author himself
Recently I have seen threads with single post with five star rating, probalbly rated by the author himself By the way , just Karthik would do... "Sir" make me feel old ..
regards
Karthik
Hi Satya,
Great thread started by you. I am specially interested in this one and was wanting to start something on similar lines as i had developed a interest in breakout trading after I followed a system posted by traderji of using three month high. ( thank you traderji for the same)
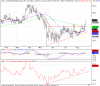
A script that has come under my scanner is gas authority. This script is interesting from studing point of view. Points to be seen
- made a three month high and hence confirms an uptrend.
-it has made an ascending right angle triangle.
-for the base of the triangle ( horizontal/support line too) I found that it was possible to draw two lines. One is a straight line and the other is a dotted line. Both the lines are also good support and resistance lines if seen in the past.
- if we had used the dotted line the breakout had been earlier on 24th or otherwise on the 25th.
The questions one can ask is
-dotted line is touched more often by the price bars and hence makes it a more promising canditate for being a breakout point. But then it also shows a false breakout on 26th of july. That breakout too was on good volumes.
- Also another question one might want to ask( including myself is) the ascending line or the trend line cannot be seen connecting the horizontal line at this point though in the future it would for sure as it is ascending. Does that make it eligible for being a right angled triangle.
My personal view is we should not use the dotted line. Even if we had used the dotted line as a breakout point earlier if we were tracking the stock at that point of time. we can always change it to the upper line after that false breakout is completed. We would have exited on little loss. It is not a mistake to change a pattern after is has formed other than what it was saying earlier. This is my own view.
we can now enter this stock above the high of the breakout on 25th aug i.e above 278. We can either use traderji's previous three day high as s/l, or the dotted horizontal line as s/l for entry or even the dotted trend line for exit.
Regarding the target price. I personally do not believe in setting a target price and follow price action to determine staying in or exiting. View on the same from other more members would be appreciated.
Rgds
Rahul
Great thread started by you. I am specially interested in this one and was wanting to start something on similar lines as i had developed a interest in breakout trading after I followed a system posted by traderji of using three month high. ( thank you traderji for the same)
A script that has come under my scanner is gas authority. This script is interesting from studing point of view. Points to be seen
- made a three month high and hence confirms an uptrend.
-it has made an ascending right angle triangle.
-for the base of the triangle ( horizontal/support line too) I found that it was possible to draw two lines. One is a straight line and the other is a dotted line. Both the lines are also good support and resistance lines if seen in the past.
- if we had used the dotted line the breakout had been earlier on 24th or otherwise on the 25th.
The questions one can ask is
-dotted line is touched more often by the price bars and hence makes it a more promising canditate for being a breakout point. But then it also shows a false breakout on 26th of july. That breakout too was on good volumes.
- Also another question one might want to ask( including myself is) the ascending line or the trend line cannot be seen connecting the horizontal line at this point though in the future it would for sure as it is ascending. Does that make it eligible for being a right angled triangle.
My personal view is we should not use the dotted line. Even if we had used the dotted line as a breakout point earlier if we were tracking the stock at that point of time. we can always change it to the upper line after that false breakout is completed. We would have exited on little loss. It is not a mistake to change a pattern after is has formed other than what it was saying earlier. This is my own view.
we can now enter this stock above the high of the breakout on 25th aug i.e above 278. We can either use traderji's previous three day high as s/l, or the dotted horizontal line as s/l for entry or even the dotted trend line for exit.
Regarding the target price. I personally do not believe in setting a target price and follow price action to determine staying in or exiting. View on the same from other more members would be appreciated.
Rgds
Rahul
Attachments
-
 49.2 KB Views: 69
Last edited:
Thanks Satya for a wonderful thread.
Hi Rahul,
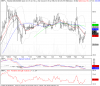
I read our analysis and is really good. But I am bit confused in this case as I can see Gail moving in a channel. In my opinion this channel has to be broken for it to be considered as a Breakout Candidate. Hence we may have to wait till it breaks out this trend, is it not? please look at the chart attached.
I saw you drawing the trend lines at the highs and lows, just connecting about 2 points. Is it ok? I remember to have read from the seniors in this forum that this need not be strictly followed. do we get a better picture if we draw the trendlines more near to the open and close prices "or" by even drawing the lines closer to the highs and lows but taking care that the line should touch atleast 3 or more highs and lows? highs and lows are generally manipulated prices and few times they are absurd.
Here, is it required that the triangle has to be complete for the prices to change the direction? I do not think so.
Many case I have seen the Triangular "Wedge" (incomplete triangles) formations before any decisive moves.
Please correct me if I am wrong.
Regards
Chachi
-it has made an ascending right angle triangle.
-for the base of the triangle ( horizontal/support line too) I found that it was possible to draw two lines. One is a straight line and the other is a dotted line. Both the lines are also good support and resistance lines if seen in the past.
- if we had used the dotted line the breakout had been earlier on 24th or otherwise on the 25th.
The questions one can ask is
-dotted line is touched more often by the price bars and hence makes it a more promising canditate for being a breakout point. But then it also shows a false breakout on 26th of july. That breakout too was on good volumes.
My personal view is we should not use the dotted line. Even if we had used the dotted line as a breakout point earlier if we were tracking the stock at that point of time. we can always change it to the upper line after that false breakout is completed. We would have exited on little loss. It is not a mistake to change a pattern after is has formed other than what it was saying earlier. This is my own view.
we can now enter this stock above the high of the breakout on 25th aug i.e above 278. We can either use traderji's previous three day high as s/l, or the dotted horizontal line as s/l for entry or even the dotted trend line for exit.
Regarding the target price. I personally do not believe in setting a target price and follow price action to determine staying in or exiting. View on the same from other more members would be appreciated.
Rgds
Rahul
I read our analysis and is really good. But I am bit confused in this case as I can see Gail moving in a channel. In my opinion this channel has to be broken for it to be considered as a Breakout Candidate. Hence we may have to wait till it breaks out this trend, is it not? please look at the chart attached.
I saw you drawing the trend lines at the highs and lows, just connecting about 2 points. Is it ok? I remember to have read from the seniors in this forum that this need not be strictly followed. do we get a better picture if we draw the trendlines more near to the open and close prices "or" by even drawing the lines closer to the highs and lows but taking care that the line should touch atleast 3 or more highs and lows? highs and lows are generally manipulated prices and few times they are absurd.
- Also another question one might want to ask( including myself is) the ascending line or the trend line cannot be seen connecting the horizontal line at this point though in the future it would for sure as it is ascending. Does that make it eligible for being a right angled triangle.
Many case I have seen the Triangular "Wedge" (incomplete triangles) formations before any decisive moves.
Please correct me if I am wrong.
Regards
Chachi
Last edited:
Hi Satya,
Great thread started by you. I am specially interested in this one and was wanting to start something on similar lines as i had developed a interest in breakout trading after I followed a system posted by traderji of using three month high. ( thank you traderji for the same)
A script that has come under my scanner is gas authority. This script is interesting from studing point of view. Points to be seen
- made a three month high and hence confirms an uptrend.
-it has made an ascending right angle triangle.
-for the base of the triangle ( horizontal/support line too) I found that it was possible to draw two lines. One is a straight line and the other is a dotted line. Both the lines are also good support and resistance lines if seen in the past.
- if we had used the dotted line the breakout had been earlier on 24th or otherwise on the 25th.
The questions one can ask is
-dotted line is touched more often by the price bars and hence makes it a more promising canditate for being a breakout point. But then it also shows a false breakout on 26th of july. That breakout too was on good volumes.
- Also another question one might want to ask( including myself is) the ascending line or the trend line cannot be seen connecting the horizontal line at this point though in the future it would for sure as it is ascending. Does that make it eligible for being a right angled triangle.
My personal view is we should not use the dotted line. Even if we had used the dotted line as a breakout point earlier if we were tracking the stock at that point of time. we can always change it to the upper line after that false breakout is completed. We would have exited on little loss. It is not a mistake to change a pattern after is has formed other than what it was saying earlier. This is my own view.
we can now enter this stock above the high of the breakout on 25th aug i.e above 278. We can either use traderji's previous three day high as s/l, or the dotted horizontal line as s/l for entry or even the dotted trend line for exit.
Regarding the target price. I personally do not believe in setting a target price and follow price action to determine staying in or exiting. View on the same from other more members would be appreciated.
Rgds
Rahul
Well, i am also a learner like, so expect some mistakes :d. I am giving a very basic and simple analysis not going too deep.
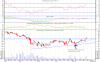
I am attaching Daily and Weekly Charts of GAIL.
Reading the Weekly first (remeber the lesson, higher timeframe frist
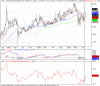
), GAIL formed a Symmetrical Triangle looks for those line i drew. It has given a nice break-out and has to sustain. 275 levels being the major resistnace, RSI is at 54 and may peak a bit.coming to daily charts, its obvious, we can see the break-out from the ascending triangle. not to worry when the break-out happened. RSI has formed a nice trend line, currently at 66.
The beauty of a Bullish Divergence can be seen on RSI. On May 22nd the prices touched a new low and also RSI touching new low of 21 (Over Sold).
Check for June 19th 2006, prices touch the new low, but RSI is trending up. Those who caught this at that stage would have made a cool 70-80 rupees profit.
Satya
Attachments
-
 19.1 KB Views: 57
 -
 18.5 KB Views: 57
Dear Abhay
You are very correct about good threads getting buried under flood of posts. I had also expressed this before. I remember this particular thread on Breakouts since I was an active participant in that.
Once idea could be a sticky thread under each main topic whuch priveds the link to the best threads in that section. But that should be a closed thread with traderji or somebody else only adding the threads. Otherwise we will have all many members adding their thread to it. Recently I have seen threads with single post with five star rating, probalbly rated by the author himself
By the way , just Karthik would do... "Sir" make me feel old ..
regards
Karthik
You are very correct about good threads getting buried under flood of posts. I had also expressed this before. I remember this particular thread on Breakouts since I was an active participant in that.
Once idea could be a sticky thread under each main topic whuch priveds the link to the best threads in that section. But that should be a closed thread with traderji or somebody else only adding the threads. Otherwise we will have all many members adding their thread to it.
Recently I have seen threads with single post with five star rating, probalbly rated by the author himself By the way , just Karthik would do... "Sir" make me feel old ..
regards
Karthik
SIR makes you feel odd and Karthik makes me feel odd... I write SIR as a visible expression of my feelings towards people like you... but thats ok... when you respect the person for his views and his understanding on a particular subject, you may call him / her anything... namse kya farak padata hai ? Whats in ur heart is more important...
So... thanks Karthik for those wonderful pointers...
With regards,
Abhay (AAD)
| Thread starter | Similar threads | Forum | Replies | Date |
|---|---|---|---|---|
| J | Please post successful breakouts of TRIANGLE pattern | Technical Analysis | 11 | |
|
|
Learning to trade breakouts, Supports & Resistance | General Trading & Investing Chat | 82 | |
|
|
Breakouts | Technical Analysis | 7 | |
|
|
Best Time to enter Breakouts | Day Trading | 3 | |
|
|
Learning to catch High Probability Breakouts | Technical Analysis | 4547 |
Similar threads
-
Please post successful breakouts of TRIANGLE pattern
- Started by john302928
- Replies: 11
-
 Learning to trade breakouts, Supports & Resistance
- Started by sunny_cool
- Replies: 82
-

-

-
 Learning to catch High Probability Breakouts
- Started by amitrandive
- Replies: 4,547