BankNifty

Nish

Well-Known Member
#41
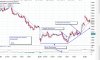
Got good opportunity to short BN.

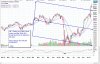
Chart shows 5/15EMA break-down on 10m , quick 300 pts from 31380 to 31090 ( adjusted ) !


If support of 30850 not broken, may we see a Gap-up on 27Jan ? .. Really NOT sure since volatility rules currently and IVix is up 3 % at 23 !

View strictly for STUDY PURPOSE !
 

Attachments

Nish

Well-Known Member
#43
If BN support remain intact around 29800 to 30000 zone and vilatility subsides a bit , then a bounce upward till 30700 +/- posible - from my POV only !


On daily chart from Sept-2020 till date, a Trendline support exist around 30250 +/-

IIF this support breaks then a posible downward range upto 27500 +/- also emerges - which looks difficult but NOT imposible !


View strictly for STUDY PURPOSE !
 

Attachments

Nish

Well-Known Member
#44
As anticipated in prvs post, if sustained above 29800 to 30000 zone , BN tried hard to push towards 30700, but could achieve till 30464 only.

If this is only expiry day short-covering then downtrend may continue below 29800.

But if 29800 to 30250 zone support holds, then 30630 and above that 31030 posible again !


View strictly for STUDY PURPOSE !
 

Nish

Well-Known Member
#45
As expected BN touched 30700 today - at last !

04Feb 31000CE rose from 202 ( Yday low 181) to 410 ( todays high 494 ) !

Done for today ! :)

The chart show BN 5m Base formation, Simple Breakout and confirmed break-out ! May be some newbees observe it for some clues in future !


BN 31000 posible ? Not sure !
BN 29800 minus ? Not sure !
Sideways till budget ? Maybe !

Surprisingly, OTM PEs like 28000PE and 29000PEs also in positive and much up from days low !

For next trade , will wait till Budget day !

View strictly for STUDY PURPOSE !
 

Attachments

Nish

Well-Known Member
#46
As per last post, patiently waited till budget day, and then LONG option trades gave fantastic rewards for next 8 days ! :)

For me, BN in temp over-sold territory but sup is around MidBB and 20EMA at 34500 which can be tested, as Stochstic has still scope for dnside.

Note:
1) 34EMA is at 33900 and 50 EMA is around 32800.
2) On daily basis ADX DMI+ is still in Bullish mode at 33 compared to DMI- at 20.
3) RSI at 64 still abv 50 - 53 range, so theoritically Bullish, but since coming down from 74 level so in temp Bearish scale.

For my trading :

120m chart is very BEARISH !

1) BN staying below 35750 may show 35500 to 34622 level.
2) BN staying above 35960 may show 36120 to 37000 .

Wkly chart shows some posibility - theoritically only !

View strictly for STUDY PURPOSE !
 

Attachments

#47
As per last post, patiently waited till budget day, and then LONG option trades gave fantastic rewards for next 8 days ! :)

For me, BN in temp over-sold territory but sup is around MidBB and 20EMA at 34500 which can be tested, as Stochstic has still scope for dnside.

Note:
1) 34EMA is at 33900 and 50 EMA is around 32800.
2) On daily basis ADX DMI+ is still in Bullish mode at 33 compared to DMI- at 20.
3) RSI at 64 still abv 50 - 53 range, so theoritically Bullish, but since coming down from 74 level so in temp Bearish scale.

For my trading :

120m chart is very BEARISH !

1) BN staying below 35750 may show 35500 to 34622 level.
2) BN staying above 35960 may show 36120 to 37000 .

Wkly chart shows some posibility - theoritically only !

View strictly for STUDY PURPOSE !
This chart is very cryptic. What is the timeframe ?
 
#49
OK ! Same prvs Wkly chart using another Web site showing Period Span !

Though it is not for Day-to-Day trading , but hope now it is not cryptic ! :)

By the way, if downtrend continue then BN 34000PE is on my watch-list at a bit lower price than the current price !
Looks like some kind of pitchfork.

I am reminded of our member kavima who used it regularly. Not active nowadays here.
 

Similar threads