AFL required for displaying WT AVG Price

#13
shajans, if you are asking to plot wt close as a line on price chart,
add this line - Plot(wtdc, "", colorRed, styleBar);

ananth sir, pls correct if i am wrong.

-----
mohan.
Thank you Mohan;

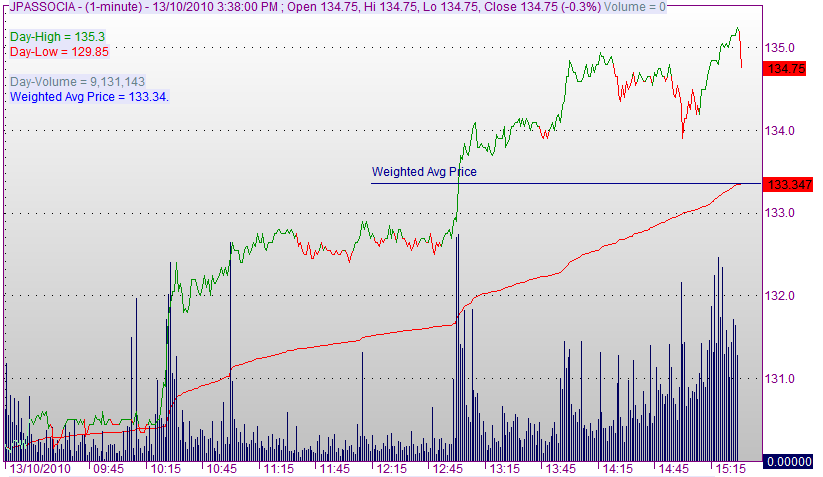
I did plot with your above code. Thanks for the same. I am looking for a horizontal line based on the last tick that has come in for intraday, please see image below:

Once I get that, planning to put yesterday's close, Day's High, and Day's Low the same way.

Thanks,
Shajan.

 
Last edited:

asnavale

Well-Known Member
#14
shajans, if you are asking to plot wt close as a line on price chart,
add this line - Plot(wtdc, "", colorRed, styleBar);

ananth sir, pls correct if i am wrong.

-----
mohan.
Hi Mohan,

Change the 'styleBar' to 'styleLine'. The code will plot a line representing the Wtd close. What shajans wants is a horizontal line drawn at a height equal to latest value of wtd close. So, as new data comes in the line should vary in height but remain parallel to the X-axis. At the end of the day the horizontal line will coincide with the day's wtd average. This can be done.

-Anant
 
#15
Hi Mohan,

Change the 'styleBar' to 'styleLine'. The code will plot a line representing the Wtd close. What shajans wants is a horizontal line drawn at a height equal to latest value of wtd close. So, as new data comes in the line should vary in height but remain parallel to the X-axis. At the end of the day the horizontal line will coincide with the day's wtd average. This can be done.

-Anant
Hi Anant:

You got that right. I did change the "styleBar" to "styleLine." The above image is with styleLine.

Thanks once again.
Shajan.
 

asnavale

Well-Known Member
#17

asnavale

Well-Known Member
#18
Thank you Mohan;

I did plot with your above code. Thanks for the same. I am looking for a horizontal line based on the last tick that has come in for intraday, please see image below:

Once I get that, planning to put yesterday's close, Day's High, and Day's Low the same way.

Thanks,
Shajan.


Hi shajans,

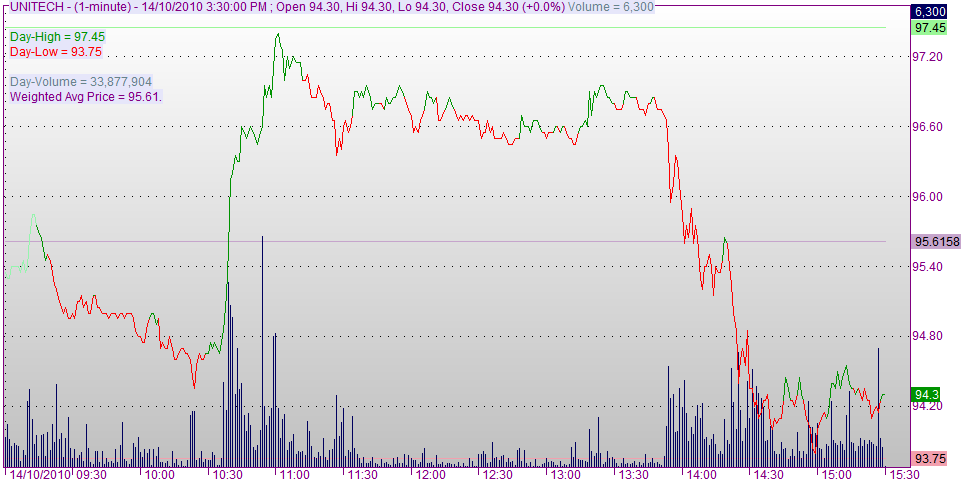
The following modified AFL gives you what you are looking for. The wtd Close is plotted on the chart as a gold colored line while a red colored horizontal line is drawn at the last wtd close price. This red line starts from the biginning of the last day in the chart and extends upto the latest bar in the chart. Try it and give feed back.


_SECTION_BEGIN("WTD_CLOSE");

/************** WEIGHTED AVERAGE CLOSE PRICE **************/

SetChartOptions(0, chartShowDates | chartWrapTitle);

SetBarsRequired( sbrAll ); //If you are using AmiBroker version less than 5.2 then delete this line

startx = 0;
starty = C[0];
endx = BarCount - 1;
endy = C[endx];

DN = DateNum();

PV = C * V;
CumV = Cum(V);
CumPV = Cum(PV);
WTDC = CumPV / CumV;

for(i = 1; i< BarCount; i++)
{

CumV = V + CumV[i - 1];
CumPV = PV + CumPV[i - 1];
WTDC = CumPV / CumV;
starty = endy = WTDC;

if(DN != DN[i - 1])
{
startx = i;
CumV = V;
CumPV = PV;
WTDC = C;
}
}

drawline = LineArray(startx, starty, endx, endy);

if(Status("action") == actionIndicator)
{
_N(Title = StrFormat("{{NAME}} ({{INTERVAL}} {{DATE}} {{OHLCX}}, V=%1.0f, {{VALUES}}\n", V));
Plot(C, "", colorGrey50, styleBar);
Plot(WTDC,"Wtd Close", colorGold, styleLine);
Plot(drawline, "Last Wtd Close", colorRed, styleLine);
}

if(Status("action") == actionExplore)
{
Filter = 1;
SetOption("NoDefaultColumns", True);
AddColumn(DateTime(), "Date", formatDateTime);
AddColumn(C, "Close", 1.2);
AddColumn(V, "Volume", 1.0);
AddColumn(PV, "C X Vol.", 1.2);
AddColumn(CumV, "Cum.Vol.", 1.0);
AddColumn(CumPV, "Sum PV", 1.2);
AddColumn(WTDC, "Wtd. Close", 1.2);
}

_SECTION_END();


-Anant
 

Similar threads