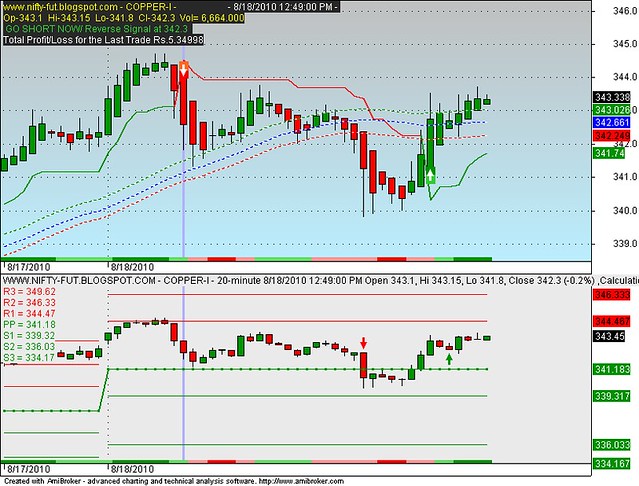
anybody have this AFL plz share it
_N(Title = StrFormat(EncodeColor( colorGold) + "{{NAME}} - {{INTERVAL}} {{DATE}} Open %g, Hi %g, Lo %g, Close %g (%.1f%%) {{VALUES}}", O, H, L, C, SelectedValue( ROC( C, 1 ) ) ));
SetChartOptions(0,chartShowArrows|chartShowDates);
// Background to suit my blog
SetChartBkColor(ColorRGB(23,23,23));
// Display line chart for tick data automatically
priceStyle = IIf( (Interval(0) == -900), styleLine, styleBar);
// Quick counting of bars by range selector
if (BeginValue(BarIndex()) != 0 AND EndValue(BarIndex()) != BarCount-1) {
range = EndValue(BarIndex())-BeginValue(BarIndex());
Title += StrFormat("\nRange Bars: %g", range);
}
CandleBorder = ParamColor("Candle Border Color", colorBlack );
UpCandleColor = ParamColor("Up Candle Color", colorGreen );
DownCandleColor = ParamColor("Down Candle Color", colorRed );
// set amibroker to display colored bars
Graph0BarColor = IIf( C > O,UpCandleColor ,DownCandleColor);
Plot( C, "Close", CandleBorder, styleNoTitle | ParamStyle("Style") | priceStyle );
//****************************************//
// Author:
[email protected]
// Web:
http://www.chartreader.co.in/
//****************************************//
_N(Title = StrFormat(EncodeColor( colorGold) + "{{NAME}} - {{INTERVAL}} {{DATE}} Open %g, Hi %g, Lo %g, Close %g (%.1f%%) {{VALUES}}", O, H, L, C, SelectedValue( ROC( C, 1 ) ) ));
SetChartOptions(0,chartShowArrows|chartShowDates);
// Background to suit my blog
SetChartBkColor(ColorRGB(23,23,23));
// Display line chart for tick data automatically
priceStyle = IIf( (Interval(0) == -900), styleLine, styleBar);
// Quick counting of bars by range selector
if (BeginValue(BarIndex()) != 0 AND EndValue(BarIndex()) != BarCount-1) {
range = EndValue(BarIndex())-BeginValue(BarIndex());
Title += StrFormat("\nRange Bars: %g", range);
}
CandleBorder = ParamColor("Candle Border Color", colorBlack );
UpCandleColor = ParamColor("Up Candle Color", colorGreen );
DownCandleColor = ParamColor("Down Candle Color", colorRed );
// set amibroker to display colored bars
Graph0BarColor = IIf( C > O,UpCandleColor ,DownCandleColor);
Plot( C, "Close", CandleBorder, styleNoTitle | ParamStyle("Style") | priceStyle );
///////////////////////////////////////////////////////////////////////////////
// Gap Finder
// AFL that plots that unfilled Gaps encountered within the last N bars.
// Author : Adheer Pai (
[email protected])
///////////////////////////////////////////////////////////////////////////////
// Input : The number of bars ago from where to start looking for gaps.
// Default is 250 : So, by default we search for Gaps found in last 250 trading days ( 1 year )
period = Param("Lookback Period", 250, 15, 500);
// If we do not have enough bars, adjust the period accordingly.
if( BarCount - period - 1 < 0 ) period = BarCount - 2;
bIsGapUp = ( L > Ref(H, -1) ); // Identify GapUp bars
bIsGapDn = ( H < Ref(L, -1) ); // Identify GapDown bars
// We are not interested in Gap Ups and Gap Downs before the Period e.g. before the last 250 bars.
// So we clear the values for bars before the ones we are interested in.
for( i = 0 ; i < (BarCount - 1 - period) ; i++ )
{
bIsGapUp
= False;
bIsGapDn = False;
}
// Now plot GapUp bars with a Up-Triangle below its low.
PlotShapes(IIf(bIsGapUp, shapeSmallUpTriangle, shapeNone), colorBlue, 0, L, -12 );
// Now plot GapDown bars with a Down-Triangle below its high.
PlotShapes(IIf(bIsGapDn, shapeSmallDownTriangle, shapeNone), colorRed, 0, H );
// Now walk from the first bar (e.g 250 bars ago, to the current bar)
for( i = (BarCount - period - 1) ; i <= (BarCount - 1) ; i++ )
{
dUpper = 0.0; dLower = 0.0; bFilled = True;
// Is the current bar a Gap-Up bar ?
if( bIsGapUp == True )
{
// If yes, the store the Gap (Upper value) and Lower values.
dUpper = L; dLower = H[i-1]; bFilled = False;
// Now walk till the current bar and see if the Gap values have been filled from Above.
// I.e prices are falling and the gap is being falled.
for( j = i+1; j <= (BarCount - 1) ; j++ )
{
// Check whether the current low is lesser than the Gap high. If yes, the Gap
// has been penetrated.
if( L[j] < dUpper )
{
dUpper = L[j];
// Determine whether the Gap has been fully penetrated - if yes, then the
// Gap has been filled.
if( dUpper <= dLower ) bFilled = True;
}
if( bFilled == True ) break;
}
}
else if( bIsGapDn == True )
{
// Same logic as GapUp - except we check whether the Gap has been pierced from Below.
// i.e Prices are rising and the Gap has been filled.
dUpper = L[i-1]; dLower = H; bFilled = False;
for( j = i+1; j <= (BarCount - 1) ; j++ )
{
if( H[j] > dLower )
{
dLower = H[j];
if( dLower >= dUpper ) bFilled = True;
}
if( bFilled == True ) break; // Gap was filled, so move on to find the next gap.
}
}
if( bFilled == False ) // Gap Not filled - so plot horizontal line at the Gap Level.
{
pLine = LineArray(i-1, dLower, BarCount-1,dLower, 1);
Plot(pLine, "", colorRed, styleDashed);
pLine = LineArray(i-1, dUpper, BarCount-1, dUpper, 1);
Plot(pLine, "", colorBlue, styleDashed);
}
}


