C
Hi, I noticed many charts are following this pattern, can someone explain:
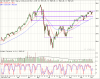
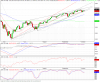
See the dotted trendlines, they fall certain degrees after say 1/1.5 months to a lower degree where the old line becomes the resistance line... would appreciate if someone can explain a learner please...thanks")
See the dotted trendlines, they fall certain degrees after say 1/1.5 months to a lower degree where the old line becomes the resistance line... would appreciate if someone can explain a learner please...thanks
Attachments
-
 34.8 KB Views: 45