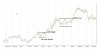
for any share for long term..cup with handle shape is very important..70% of shares are following this chart..for example i have attached a graph of M&M.
Well, that needs a lot of fantasy to see two "Cup with handle chart pattern" in your chart. The first one I agree and the second one is a buy signal, as mentioned from you, but to see a cup with handle here is somehow really to question.
http://thepatternsite.com/cup.html But nevertheless and as long as money is made, it does not matter how it is called what is seen in the chart. Success rate of the "Cup with handle chart pattern" can be seen in the link I posted and this is by far less compare to your mentioned 70% (Just have a look at the numbers under:
Important bull market results for cup with handle)
On the other hand: I can see two cup with handle chart pattern with some fantasy in your chart and those would be "Inverted cup with handles chart pattern"
http://thepatternsite.com/icup.html The first one failed and could be seen at the begin of your chart (Start middle of November and cup finished around middle of week two in January 2014. Now forming the handle for one and a half week before finishing the whole chart pattern). Then there was a small down move but market could finally not take out the support. Now if I look at the just mentioned as a "Rounding top", then it would be successful.
The second possible "Inverted Cup with handle chart pattern" one could see would start in the middle of August. The cup was finished in middle of October. Now the handle forms until end of October and if one want you still could say it formed until end of November and now the chart would need to prove (for both way of looking at it) that support was token, but that is no more seen in your chart. Here again you also could look at it as a rounding top
http://thepatternsite.com/roundingtop.html .
Take care and have a nice day