thanks ravi bro ...:thumb:
but this file not give any IV figures I think
but this file not give any IV figures I think
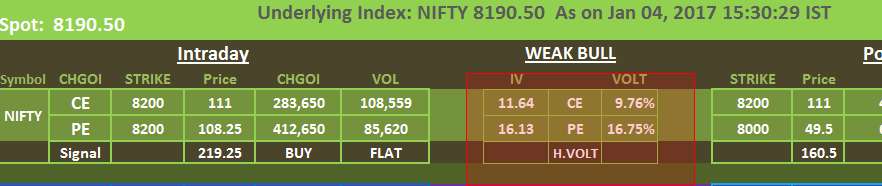
From morning, the calls were in heavy demand bcos those naked optins traders were buying calls and making money while hedgers doing same.
So calls had high IV, means expensive price.
Now, with 12:10pm sell-off, ppl started dumping calls and running for puts.
IV has reversed now and puts are in demand.
IF you see "-", means IV is basically like 0 and option is trading dirt cheap

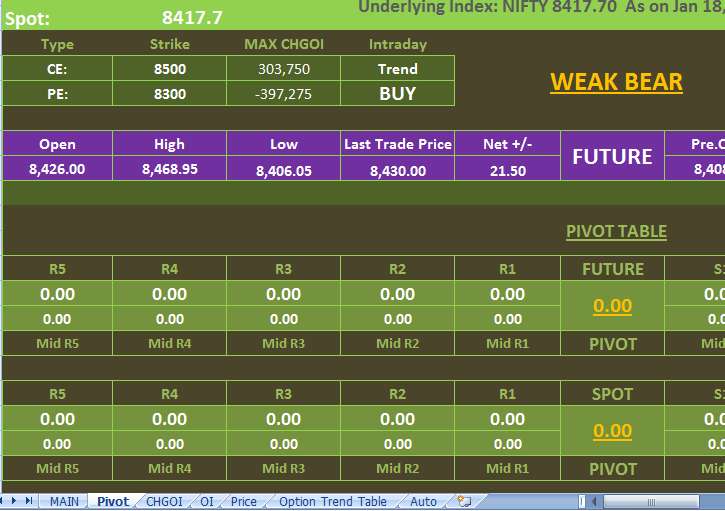
In auto sheet you can see IV.
Once you understand Greeks, you will know what is happening to them only by looking at Futures chart
Eg. Just like you know, when BNF going up, puts are falling and calls are rising.
So if you know, delta is 0.5 at ATM and 3-5 strikes away its 1 & 0.1,
1. A 20pt move will have 10pt move in price of ATM option.
2. Keep the max pain value in mind and see if that changes, bcos naked eye can't compute that fast.
3. Else OI/C_OI also moves in relation to underlying.
Biggest challenge is NSE gives this data with around 3m delay so not useful for scalping but very good for higher TF 15m onwards (swing/pos etc).
Last edited: