Charts Discussion

raj_hpking

Well-Known Member
#1
Hi,

I am trying to learn charts. Hoping this is the correct place to discussion Indicators and Oscillators and learn together. I have read Teach a Man to Fish... thread long time ago and now trying to implement it...

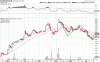
Please find attached GHCL Ltd daily Chart. As per chart it is uptrend but stochastic shows its in overbought zone. And, Moving Averages giving buy signal stating long term uptrend.
 
Last edited:

kainiteh

Well-Known Member
#2


Following is my view, I hope you missed the entry point immediately after MA at be you indicator setup or MA crossover attribute might be suitable for this time range / trending market.. test your attributed and try to make back test and have two set of attributes for trending market and trading zone.. you may following setup like MA cross over with consolidation of stochastic Cross over on Oversold or in between OS / OB... you may reentry on May 10 with tight stop loss as swing trade.... Exit on 24th May around 90... since RSI is decline and small double top forming... this due to late entry into market or you can tighten the trailing stop at 85-87 and run for long again....

This scrip is beautifully worked for Price action.. with lot of confluences between 67.5 to 70 range... Anyhow It is after market .....

All the best for your chart study
 
Last edited:

raj_hpking

Well-Known Member
#3
I am not sure but seems ALOTTEXT is building bullish AB=CD. As per pattern it should go uptrend. Correct me if I am wrong.
 
Last edited:

jagankris

Well-Known Member
#4
I am not sure but seems ALOTTEXT is building bullish AB=CD. As per pattern it should go uptrend. Correct me if I am wrong.
Just a suggestion.
Why penny stocks - try the same with some better stocks.

But in the above case with ALOKTEXT again AB <> CD.Meaning the pattern is not valid.
 
Last edited:

raj_hpking

Well-Known Member
#8
The day when I noticed this pattern, ALOKTEXT stock is increasing every day. Today it went high till 6.05 (finance.google.com). It has AGM meeting scheduled on 26 Jun. I believe this stock will go up at least till we get some news after AGM. I bought at 5.85 and keeping stoploss at 5.75 and first target 7.1 as per AB=CD pattern. This is my personal view and I am not chart expert. Just learning things from Traderji.com.
 

raj_hpking

Well-Known Member
#9
JK nice advice, should look for mid cap to large cap stocks. And, below was superb. It was again one more example of bullish AB=CD pattern formed in AARTIDRUGS on 12 Jun 2015. Please see below graph. After completion of the pattern, Aarti drugs is on fly. I wish I had bought it yesterday:rofl:
 

Attachments

raj_hpking

Well-Known Member
#10
Just a suggestion.
Why penny stocks - try the same with some better stocks.

But in the above case with ALOKTEXT again AB <> CD.Meaning the pattern is not valid.
Meanwhile, why above pattern was wrong (might be my line drawing skill is not correct :) to visualize it correctly.). Your answer will help me to understand things better. Please have a look for AARTIGRUGS too.
 
Last edited: