Hi, there. RSI or Relative Strength Index is an leading momentum based technical indicator which shows when a share/security has been overbought(people pilling on) or oversold(people selling like anything).
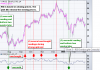
What this means is when ever the RSI line of a share/security breaches one of these 2 levels it will correct itself and start to trade at its optimum value. RSI shows these 2 levels via 2 readings, that is 70 for overbought and 30 for oversold, like the example below. When a price of the security hits 30(or moves below 30) that means it has been oversold and will now correct(Retract back) itself and go higher, hence you go long on it buy and hold the security. When it hits 70( or moves above 70), that means it has been overbought and now will go down hence one sells.
One thing to note just because it hits the 70 & 30 marks does not mean it will immediately correct itself, one needs to wait for it to come below 70 or above 30 and then go long or short on the security. Sometimes a security can remain in overbought and oversold territory for quite some time. Its all about knowing the trend with RSI to go short or long. So as soon at it retracts from said 70 and 30 levels, one should go short/sell and long/buy the said security.
RSI's calculation if you are interested
RSI = 100 - 100/1 + RS
where RS = Average Gain of 14 days / Average Loss of 14 days
the 14 day look back period is generally taken as a rule but can be changed accordingly as per user needs. its called the look back period.
A lot of people use look back period as 10 days also and 80 for over bought and 20 for oversold. its all about their view and how stock sensitive they want the indicator to be.