Hi,
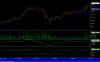
Please find the NTPC EOD chart attached.
There is a Diamond formation, in a complext H&S continuation pattern formed with a V Shaped neckline.
The averages are crossing each other.
Based on this is it BUY with a price target around 155.
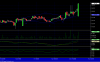
However on the last day(in the candle stick chart) there is bearish shooting star formation on the last day,can this be ignored and should one wait to get into it.
I would appreciate if some experts could analyse this stock chart.
Thanks and Regards,
Vikranth
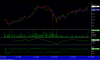
Please find the NTPC EOD chart attached.
There is a Diamond formation, in a complext H&S continuation pattern formed with a V Shaped neckline.
The averages are crossing each other.
Based on this is it BUY with a price target around 155.
However on the last day(in the candle stick chart) there is bearish shooting star formation on the last day,can this be ignored and should one wait to get into it.
I would appreciate if some experts could analyse this stock chart.
Thanks and Regards,
Vikranth
Attachments
-
 20.3 KB Views: 103