


Hello,
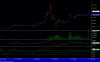
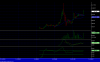
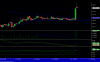
Find attched EOD chart of GESCO,
Both on weekly and daily chart there is a breakout from an ascending triangle. Moving averages are crossing each other.
Based on this is it a BUY for GESCO, if so what should be the target. I would appreciate some expert analysis of the chart pattern.
I am also attatching the candle stick chart, I dont know what it indicates, can someone pls help me on this also
Thanks and Regards,
Vikranth
Attachments
-
 18.9 KB Views: 33
 -
 13.2 KB Views: 23
 -
 13.9 KB Views: 24