Hi!
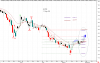
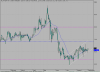
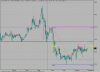
I would be grateful if someone could please guide on drawing support & resistance lines on charts where there is a lot of noise. A few examples would be much appreciated.
Also, does one draw the lines on the daily charts or weekly charts?
The reason why I am asking is because on some of the daily charts, it takes some doing to identify support & resistance levels.
Please do advise ...
Thanks & regards,
Amit
")