amitkr said:
Hi,
Still trying to learn...Will appreciate help
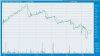
Please explain this intraday chart of Liberty phosphate...
Is this manipulated?
Thanks
Amit
AMIT
1. Look at the volumes
2. Look at the bigger picture (longer term charts ... longer than one day in any case)
3. Look at the fundas (check the news)
See chart I have attached , and make your own deductions... u will find the answers.
The intraday trend which has puzzled you looks like mere profit taking
The longer term (recent surge , as also the quadrupling in Apri/May) looks like insider trading (no crime .. its universal and ubiquitous) driven by news (preferential issue) and also by better current working (PE based on Dec end results is just 6x, annaulaised EPS being around 10)
Hope this helps...
AGILENT

PS By the way, since you appear to be 'in' the stock, what info do you have. That will clarify the chart to some extent won't it ? Do share with us


 Please suggest a trading terminal for my requirement.