")
Hi,
I've been trying to learn and understand the role of volumes in trading. Have read a few things and started to understand a bit but want some people who frequently use volume analysis for trading to evaluate my understanding of this aspect of trading. (I am not using any indicators such as OBV yet, plainly going by no. of shares traded on NSE)
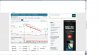
Heres a pic file of Jetairways and my interpretation of the price and volume effects. (Please rectify me wherever necessary
1. Early Nov (8th) the stock opened at 809 and closed at 890 with very high volumes. My understanding is that a lot of investors have shown interest in the stock. Price jump coupled with High volumes is a sort of confirmation of higher prices in next few sessions.
Day 2- The stock traded slightly higher for 1 day and the volume dropped the next day. Which from my understanding means, its time to sell the stock since its lost the volume backed strength.
Day 3- The stock shows a slight fall in price and had a very big drop in volume.
Since then the stock has been on a downtrend with slight corrections till Dec end but the Volumes have been within the same range with 1 or 2 spikes during the downtrend.
Its now been trading sideways without a drop or change in volumes.
However the last 2 trading sessions have shown significantly higher volumes from Jan 4th and today the price has shot up a bit.
My questions:
Is the stock ready for another short term uptrend? Plainly on the basis of price action and volume.
What is the next Price - Volume movement I should keep my eyes open for which would indicate and up or downtrend?
PS. This is a new subject for me so Hope i made some sense.