Techinals - novice

#1
Hello members,

I am a new entrant to this site.

I paste here an online study for technical analysis of selective stocks.

The material is for study purpose only.

This is not in any way a buy or sell recommendation.

Suggestions/critics are most welcome.

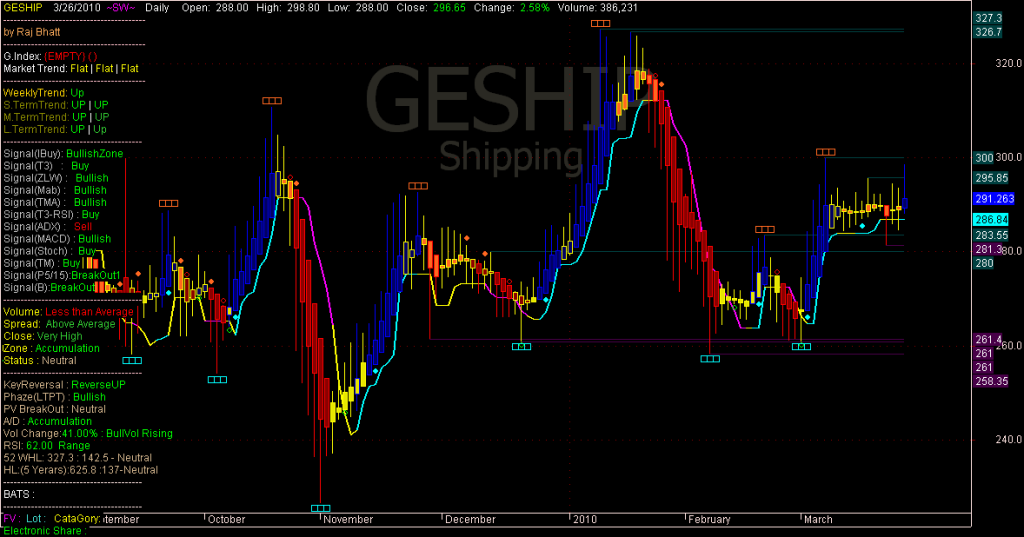
The Foundation sample which I found on traderji.com.

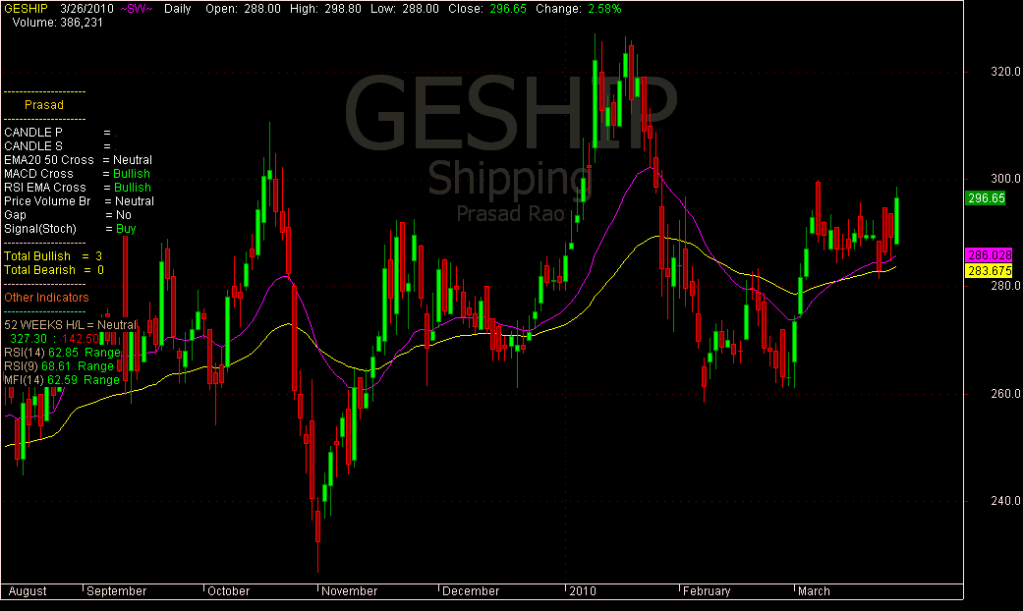
All the indicators here are showing bullish signals for GE SHip on 26.03.2010

In fact the Foudation has vast parameters while I chalked out limited parameters.

Just have a look at the Foundation chart below.


Last edited:
#2
Indicators

I chalked out only a few parameters and programmed to get this out put.

Inspite of a limited parameters the signals are in harmony with the foundation.

The same chart of GE Ship shows total bullish here as well.


#3
Exploration

The exploration is programmed to give the following output.

<a target='_blank' title='ImageShack - Image And Video Hosting' href='http://img249.imageshack.us/i/srfile201041171940654.jpg/'><img src='http://img249.imageshack.us/img249/7582/srfile201041171940654.jpg' border='0'/></a>


:thumb:
 
Last edited:

SwingKing

Well-Known Member
#6
Software is Amibroker. He is using an afl and that's the reason things are looking a bit different.

Tc
 
#8
Agro dutch

Just a study of how a stock move technically.

I selected random samples of stocks and analysing them with remarks from 25.03.2010.


AGRO DUTCH showed a gap up on 25.03.10

A gap up is usually a bullish signal but the candle pattern resulted from the gap up was a bearish doji.

More over the RSI and the MFI indicate in a overbought territory.

Similarly 26.03.10 it formed a Hanging Man yet another day a bearish signal but the stock moving up.

29.03.10 it formed an bearish engulfing pattern.
 
#9
Ajanta pharma

In AJANTA a Bullish Harami was formed on 26.02.10 and look a the leap the stock took from there.

25.03.2010 shows bullish but concern is RSI and MFI in overbought territory.

26.03.2010 going ahead but the RSI and MFI are signaling saturation

At last on 29.03.2010 the candlestick has formed a Bearish Engulfing which indicates reversal of trend.

 
#10
Astra micro

The dark cloud cover is a strong reversal (bearish) signal.

In ASTRA the dark cloud was formed on 25.03.10.

The following day i.e. 26.03.10 the bearish pattern was confirmed.

29.03.10 the slide continues.


Similar threads