Western Technical Analysis Chart Patterns

rajputz

Well-Known Member
#1
Hi friends,

I came across a book of technical analysis of chart patterns. the really nice thing i found about this book was that it was completely based upon the chart patterns along with volume. No other indicators were used. I fond it really interesting and knowledgeable. Even i already knew about those chart pattern but Still i thought of reading it once again giving the example from Indian Stocks. I will be posting the material in this thread and will see how much we can learn.

Senior members please help me with my thread as i will also be a learner as the learning goes.....

Thanks
 

rajputz

Well-Known Member
#2
For the Basic Start, everything that is known or knowable about a stock is reflected in its chart. The chart reflects peoples reaction or action to what they know, think they know or have heard. Traditional Western technical analysis has identified certain chart patterns that convey a high probability of predicting a reversal or continuation in a shares price. Traditional textbooks will allow you to believe that chart patterns are highly accurate, but remember that 65% of all double tops and double bottoms (a chart attern) fail. Have this in mind when trying to trade with chart patterns alone. Also remember, especially when day trading, Market Makers can see the patterns too and can use patterns to trick amateur investors and those who only have a traditional knowledge of charting.


Seeing all these patterns for the first time may seem overwhelming. But focus on one or two and you will start to notice them as second nature. I see chart patterns now without identifying them by name, they are second nature in my mind as a reversal or continuation pattern. The more you analyse charts, the more familiar the patterns become.


I recommend using these chart patterns in conjunction with Eastern Technical Analysis(Candle Sticks Reading) to spot reversals before they become apparent rather than Western Technicals alone.
 

rajputz

Well-Known Member
#3
Here goes the first Formation

Double Top (Reversal)

The double top is a major reversal pattern that forms after an extended uptrend. As its name implies, the pattern is made up of two consecutive peaks that are roughly equal, with a moderate trough in-between.


though there can be variations, the classic double top marks at least an intermediate change, if not long-term change, in trend from bullish to bearish. Many potential double tops can form along the way up, but until key support is broken, a reversal cannot be confirmed. To help clarify, we will look at the key points in the formation and then walk through an example.

1. Prior Trend: With any reversal pattern, there must be an existing trend to reverse. In the case of the double top, a significant uptrend
of several months should be in place.

2. First Peak
: The first peak should mark the highest point of the current trend. As such, the first peak is fairly normal and the uptrend
is not in jeopardy (or in question) at this time.

3. Trough: After the first peak, a decline takes place that typically ranges from 10 to 20%. Volume on the decline from the first peak is usually inconsequential. The lows are sometimes rounded or drawn out a bit, which can be a sign of tepid demand.

4. Second Peak
: The advance off the lows usually occurs with low
volume and meets resistance from the previous high. Resistance from the previous high should be expected. Even after meeting resistance,only the possibility of a double top exists. The pattern till needs to be confirmed. The time period between peaks can vary from a few weeks to many months, with the norm being 1-3 months. While exact peaks are preferable, there is some leeway. Usually a peak within 3% of the previous high is adequate.

5. Decline from Peak: The subsequent decline from the second peak should witness an expansion in volume and/or an accelerated descent, perhaps marked with a gap or two. Such a decline shows that the forces of demand are weaker than supply and a support test is imminent.

6. Support Break: Even after trading down to support, the double top
and trend reversal are still not complete. Breaking support from the lowest point between the peaks completes the double top. This too should occur with an increase in volume and/or an accelerated descent.

7. Support Turned Resistance
: Broken support becomes potential resistance and there is sometimes a test of this newfound resistance level with a reaction rally. Such a test can offer a second chance to exit a position or initiate a short.

8. Price Target: The distance from support break to peak can be
subtracted from the support break for a price target. This would infer that the bigger the formation is, the larger the potential decline.
 
Last edited:

rajputz

Well-Known Member
#7
How should one analyze a horizontal trading range?
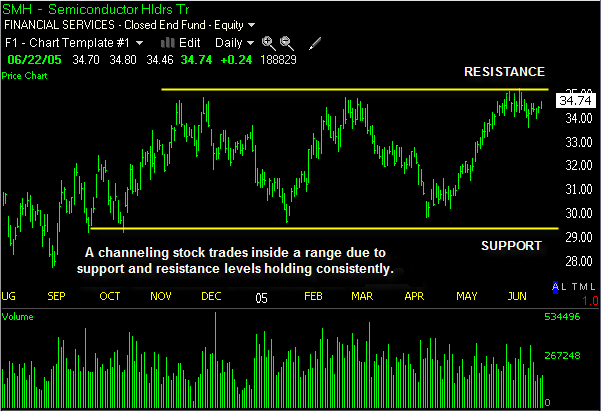
Channeling/RangeBound Stocks
Horizontal Trading range is actually part of channeling stocks or range bound stocks.

Channeling stocks are stocks that trade within a certain range between high and low price points for a period of time and may become predictable over time.

Well, trading range bound stock can be great short term money making opportunity by shorting and going long within the range.
A channel forms when stock price bounces up from support line and then drops back to near/or support line after hitting the resistance line. You can draw a parallel line connecting the top and a line connecting the bottom, rather like drawing trend lines to see the channel.

There are 3 types of channelling stocks or rolling stocks some may say:

1. Ascending Trading Range -Stocks bounce up and down the channel in a an uptrend.


2. Descending Trading Range -Stocks bounce up and down the channel in a downtrend.


3. Horizontal Trading Range -Stocks bounce up and down support and resistance level in a horizontal trading range.

 
Last edited:

rajputz

Well-Known Member
#8
Double Bottom (Reversal)

The double bottom is a major reversal pattern that forms after an extended downtrend. As its name implies, the pattern is made up of two consecutive troughs that are roughly equal, with a moderate peak inbetween.


Although there can be variations, the classic double bottom usually marks an intermediate or long-term change in trend. Many potential double bottoms can form along the way down, but until key resistance is broken, a reversal cannot be confirmed. To help clarify, we will look at the key points in the formation and then walk through an example.

1. Prior Trend: With any reversal pattern, there must be an existing trend to reverse. In the case of the double bottom, a significant downtrend of several months should be in place.

2. First Trough: The first trough should mark the lowest point of the current trend. As such, the first trough is fairly normal in appearance and the downtrend remains firmly in place.

3. Peak: After the first trough, an advance takes place that typically ranges from 10 to 20%. Volume on the advance from the first trough is usually inconsequential, but an increase could signal early accumulation. The high of the peak is sometimes rounded or drawn out a bit from the hesitation to go back down. This hesitation indicates that demand is increasing, but still not strong enough for a breakout.

4. Second Trough: The decline off the reaction high usually occurs with low volume and meets support from the previous low. Support from the previous low should be expected. Even after establishing support, only the possibility of a double bottom exists, it still needs to be confirmed. The time period between troughs can vary from a few weeks to many months, with the norm being 1-3 months. While exact troughs are preferable, there is some room to maneuver and usually a trough within 3% of the previous is considered valid.

5. Advance from Trough
: Volume is more important for the double bottom than the double top. There should clear evidence that volume and buying pressure are accelerating during the advance off of the second trough. An accelerated ascent, perhaps marked with a gap or two, also indicates a potential change in sentiment.

6. Resistance Break: Even after trading up to resistance, the double top and trend reversal are still not complete. Breaking resistance from the highest point between the troughs completes the double bottom. This too should occur with an increase in volume and/or an accelerated ascent.

7. Resistance Turned Support: Broken resistance becomes potential support and there is sometimes a test of this newfound support level with the first correction. Such a test can offer a second chance to close a short position or initiate a long.

8. Price Target: The distance from the resistance breakout to trough lows can be added on top of the resistance break to estimate a target. This would imply that the bigger the formation is, the larger the potential advance.
 
Last edited:

rajputz

Well-Known Member
#9
Head & Shoulders Top (Reversal)

A Head and Shoulders reversal pattern forms after an uptrend, and its completion marks a trend reversal. The pattern contains three successive peaks with the middle peak (head) being the highest and the two outside peaks (shoulders) being low and roughly equal. The reaction lows of each peak can be connected to form support, or a neckline.


As its name implies, the Head and Shoulders reversal pattern is made up of a left shoulder, a head, a right shoulder, and a neckline. Other parts playing a role in the pattern are volume, the breakout, price target and support turned resistance.

1. Prior Trend
: It is important to establish the existence of a prior uptrend for this to be a reversal pattern. Without a prior uptrend to reverse, there cannot be a Head and Shoulders reversal pattern (or any reversal pattern for that matter).

2. Left Shoulder: While in an uptrend, the left shoulder forms a peak that marks the high point of the current trend. After making this peak, a decline ensues to complete the formation of the shoulder (1). The low of the decline usually remains above the trend line, keeping the uptrend intact.

3. Head: From the low of the left shoulder, an advance begins that exceeds the previous high and marks the top of the head. After peaking, the low of the subsequent decline marks the second point of theneckline (2). The low of the decline usually breaks the uptrend line, putting the uptrend in jeopardy.

4. Right Shoulder: The advance from the low of the head forms the right shoulder. This peak is lower than the head (a lower high) and usually in line with the high of the left shoulder. While symmetry is preferred, sometimes the shoulders can be out of whack. The decline from the peak of the right shoulder should break the neckline.

5. Neckline: The neckline forms by connecting low points 1 and 2. Low point 1 marks the end of the left shoulder and the beginning of the head. Low point 2 marks the end of the head and the beginning of the right shoulder. Depending on the relationship between the two low points, the neckline can slope up, slope down or be horizontal. The slope of the neckline will affect the pattern's degree of bearishness: a downward slope is more bearish than an upward slope.Sometimes more than one low point can be used to form the neckline.

6. Volume: As the Head and Shoulders pattern unfolds, volume plays an important role in confirmation. Volume can be measured as an indicator (OBV, Chaikin Money Flow) or simply by analyzing volume levels. Ideally, but not always, volume during the advance of the left shoulder should be higher than during the advance of the head. This decrease in volume and the new high of the head, together, serve as a warning sign. The next warning sign comes when volume increases on the decline from the peak of the head. Final confirmation comes when volume further increases during the decline of the right shoulder.

7. Neckline Break: The head and shoulders pattern is not complete and the uptrend is not reversed until neckline support is broken. Ideally, this should also occur in a convincing manner, with an expansion in volume.
8. Support Turned Resistance: Once support is broken, it is common for this same support level to turn into resistance. Sometimes, but certainly not always, the price will return to the support break, and offer a second chance to sell.

9. Price Target: After breaking neckline support, the projected price decline is found by measuring the distance from the neckline to the top of the head. This distance is then subtracted from the neckline to reach a price target. Any price target should serve as a rough guide, and other factors should be considered as well. These factors might include previous support levels, Fibonacci retracements, or long-term moving averages.
 

sudoku1

Well-Known Member
#10
during seminars ,selling books ,live demos ,magazines..the authors rarely highlight the failed patterns as that would act as discouragement for the buyer....
only the pink side is shown full blown...:annoyed:
 

Similar threads